For the latest updates and improvements, see the latest Cloud documentation instead.
Repository Dashboard
The Repository Dashboard provides an overview of the repository code quality and items that require your attention.
To access your Repository Dashboard, select a repository from the Organization Dashboard or open a repository on any other page and select Dashboard on the left navigation sidebar.
Tip
You can share the URL of the Repository Dashboard for your public repositories to allow other people to see your repository code quality metrics, even if they aren't registered on Codacy.
The top of the Repository Dashboard displays:
- The name and code quality grade of the repository
- A drop-down list that selects which branch of your repository to display on the dashboard
On the Repository Dashboard you have four areas to help you monitor your repository:
The following sections provide a detailed overview of each dashboard area.
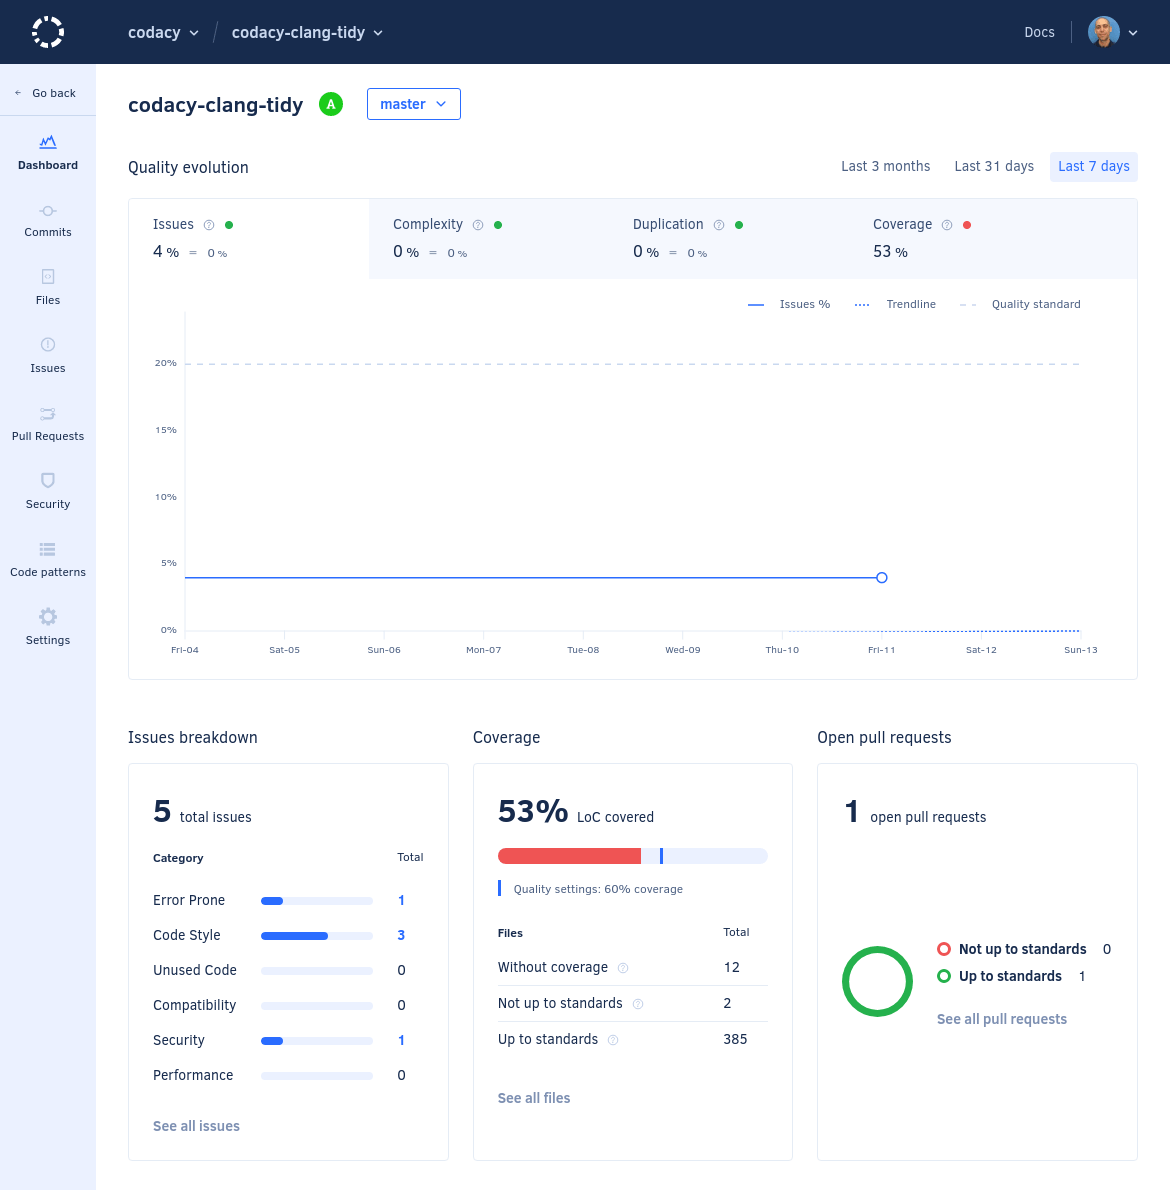
Quality evolution chart
The Quality evolution chart displays the evolution of the repository code quality regarding issues, complex files, duplication, and coverage. Click on Last 3 months, Last 31 days, or Last 7 days to select the time interval of the historical data to display on the chart.
Each tab displays the following information for the corresponding metric:
- A green or red indicator depending if the metric is within the acceptable quality level or not
- The current value
- The variation of the value introduced by the last commit
Note
The coverage tab only displays a value if Codacy received coverage data for the most recent commit. This is because one commit can easily change the size or number of files on the repository, or even remove some of the files that had coverage information.
The chart also displays the trendline based on the past behavior and the quality standard defined on the repository quality settings.
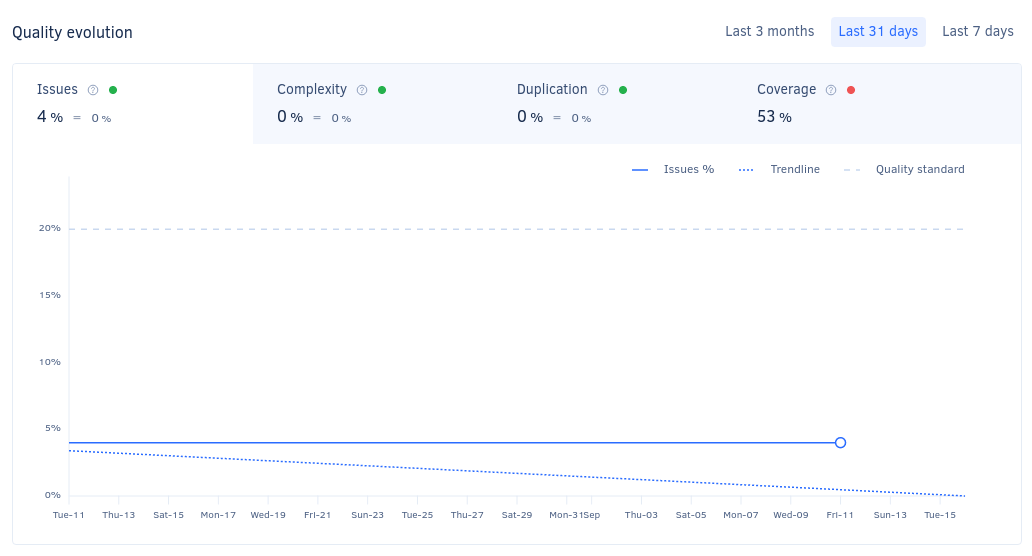
Issues breakdown
The Issues breakdown area displays the total number of issues found on the selected branch, as well as the distribution of issues across each code quality issue category.
Click See all issues to see the full list of issues found, or click a category to see the issues in that category.
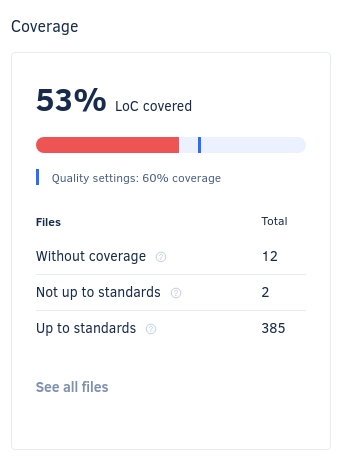
Coverage
The Coverage area displays the percentage of lines of code on the selected branch that are covered by tests versus the quality settings defined for the repository, as well as the number of files:
- Without coverage
- With coverage not up to standards (based on your repository quality settings)
- With coverage up to standards (based on your repository quality settings)
Click See all files to open the list of files in the repository.
Tip
If you don't have coverage set up for your repository yet, the Coverage area provides you with instructions on how to add coverage for your repository.
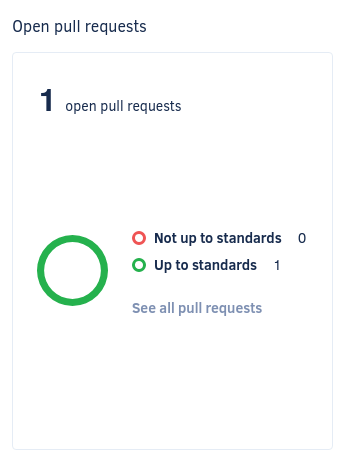
Open pull requests
The Open pull requests area displays the number of open pull requests in the repository and the split between the following status:
- Not up to standards
- Up to standards
- Analyzing (intermediate status while Codacy is analyzing the pull request)
Click See all pull requests to open the list of pull requests in the repository.
Share your feedback 📢
Did this page help you?
Thanks for the feedback! Is there anything else you'd like to tell us about this page?
255 characters left
We're sorry to hear that. Please let us know what we can improve:
255 characters left
Alternatively, you can create a more detailed issue on our GitHub repository.
Thanks for helping improve the Codacy documentation.
If you have a question or need help please contact support@codacy.com.