For the latest updates and improvements, see the latest Cloud documentation instead.
Organization Dashboard overview
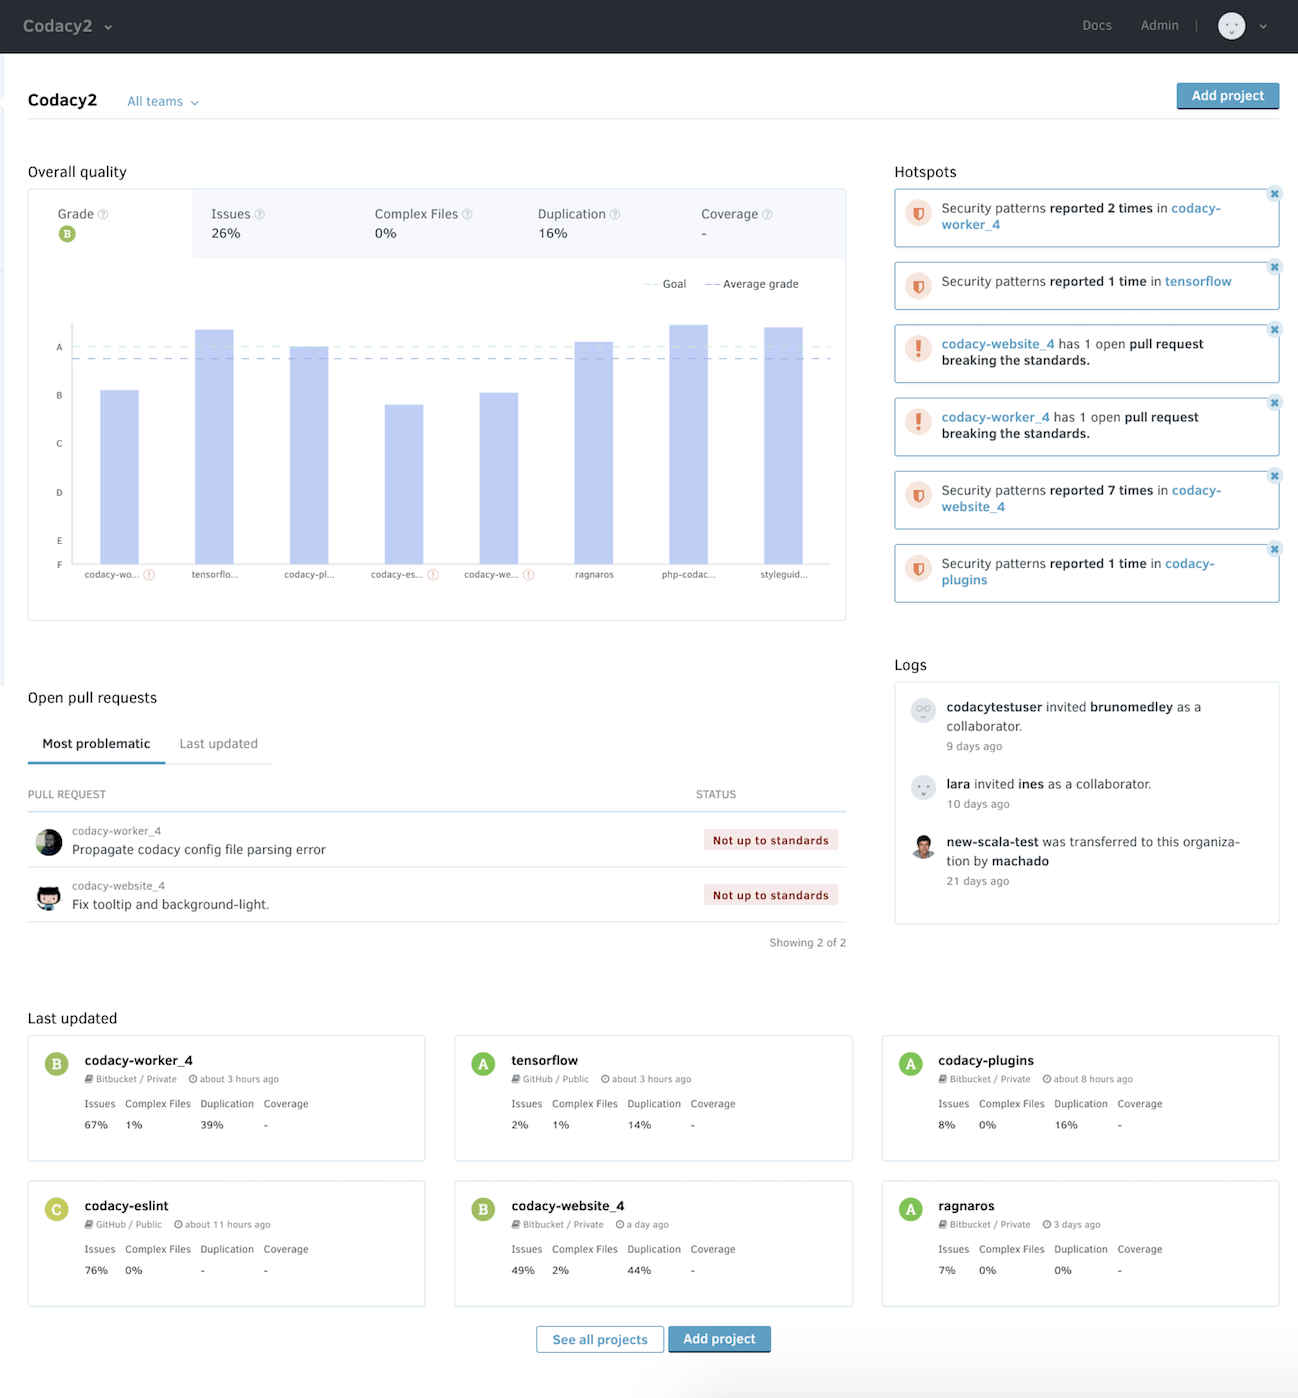
Your Organization Dashboard offers an overview of repositories that belong to the same team. Here you can compare their statuses and check for items that require your attention. See below for a detailed overview of the dashboard and its functionalities.
Overall
On the Organization Dashboard, you have 5 sections that will help you monitor your team's repositories: 1 Overall Quality Chart, 2 Hotspots, 3 Open Pull Requests, 4 Logs and 5 Last updated repositories.
How can I access the Organization Dashboard?
You can access your Organization Dashboard by selecting a specific organization in the top navigation bar or by selecting an Organization in your Account Menu.
You can also select which team(s) you would like to view in the Organization Dashboard.
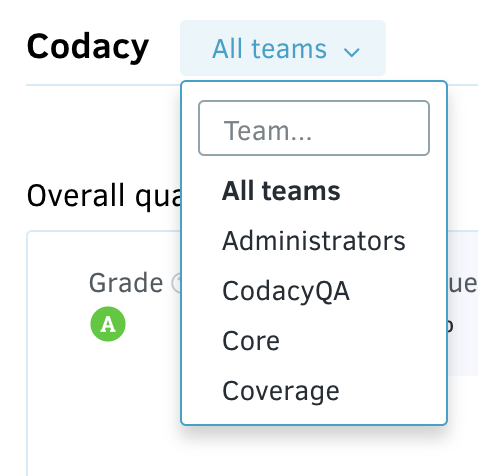
You cannot select a team that does not have any repositories to view in the Organization Dashboard.
What functionalities are available?
1. Overall Quality Chart
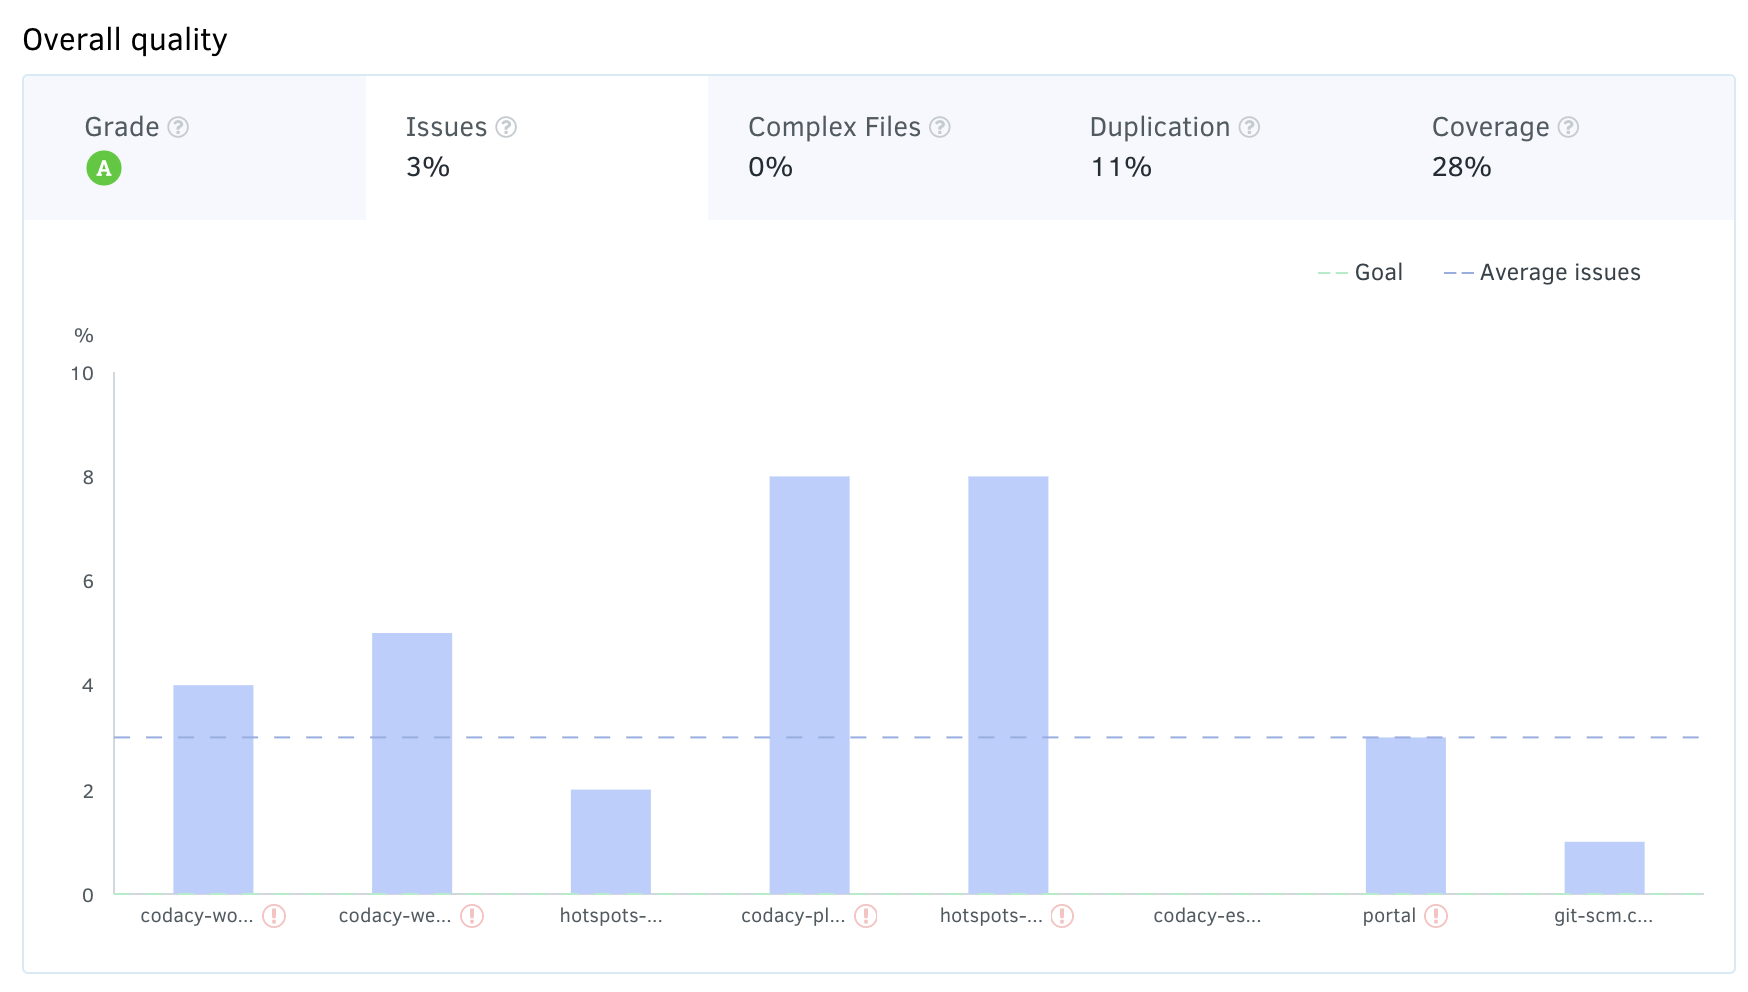
The Overall Quality Chart displays your repositories and compares them against the average grade, your defined goal, and across each specific criteria: Issues, Complex Files, Duplication, and Coverage.
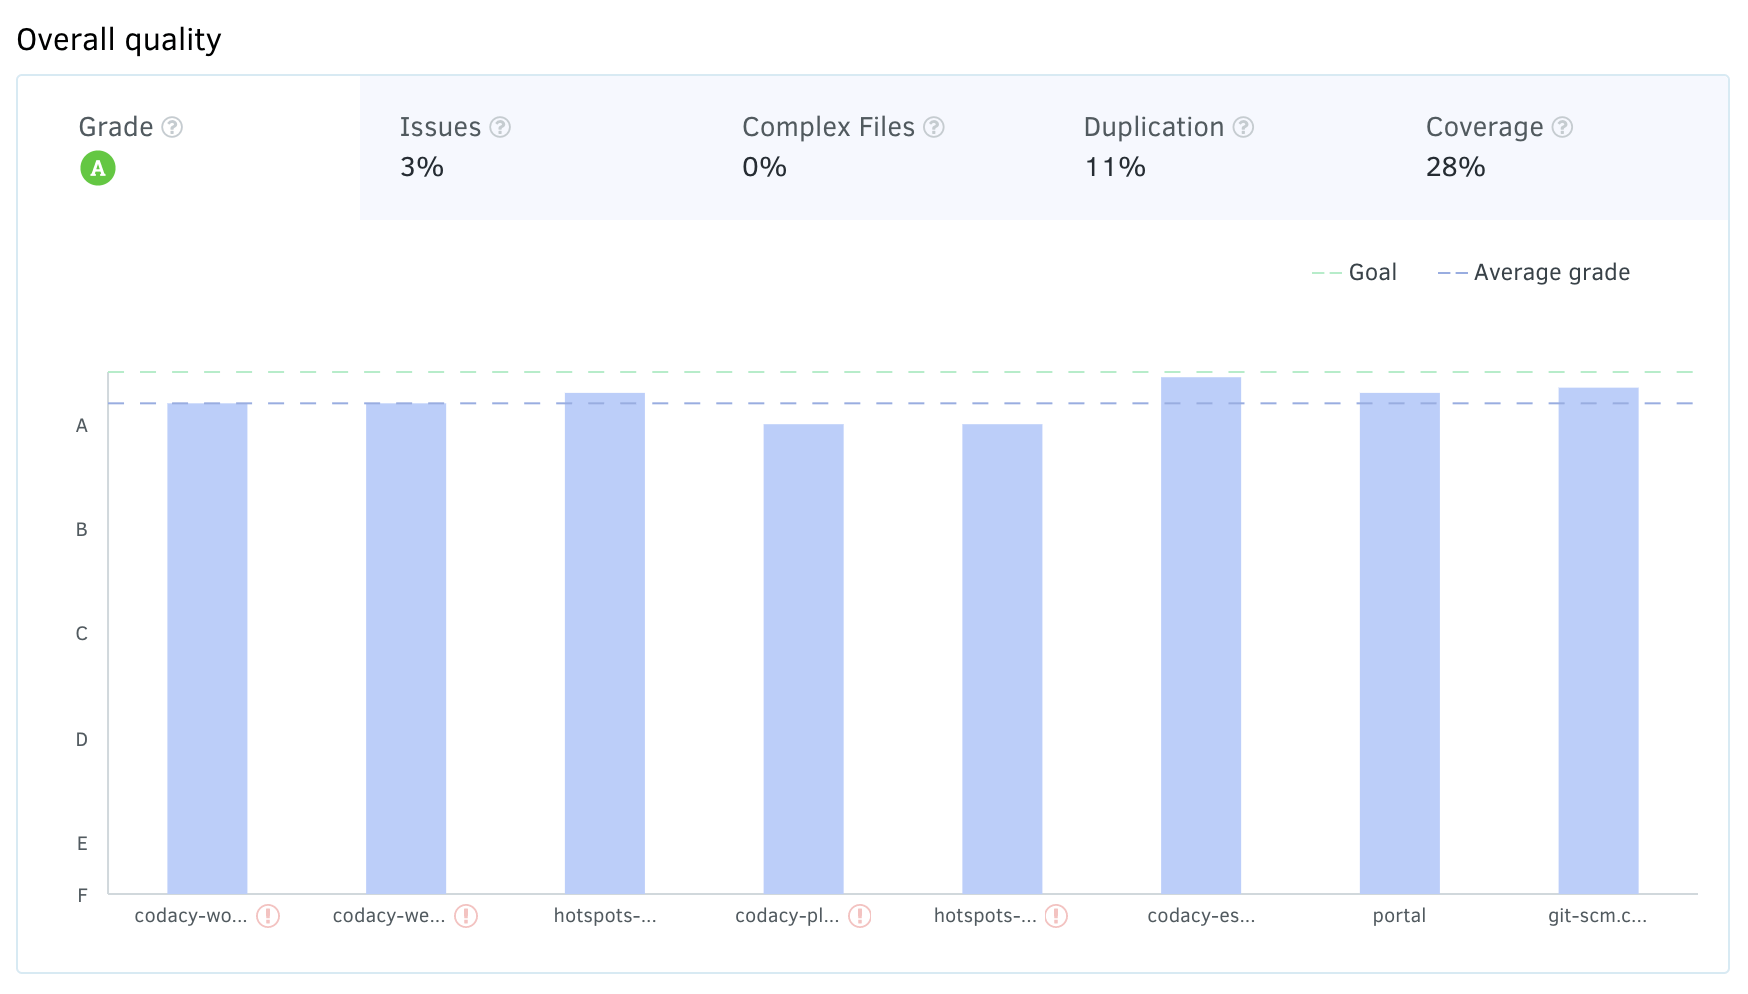
- In the upper left is the average grade (A, in this example).
- The graph displays how different repositories match up to your goals and the average grade.
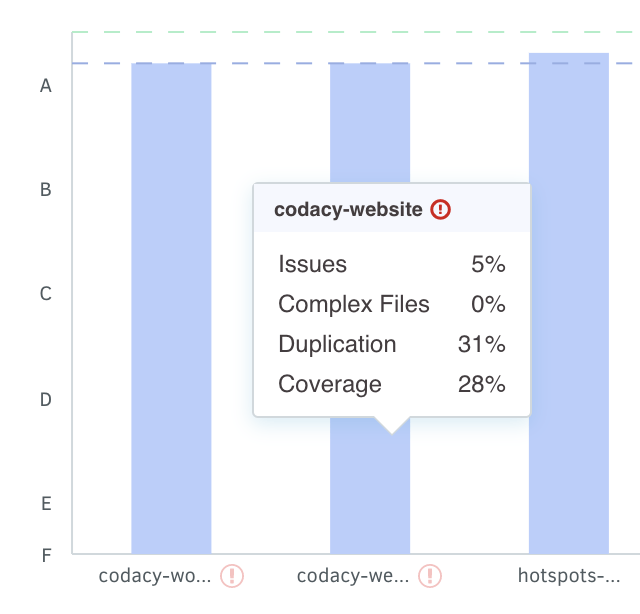
- You can see how each repository is performing by hovering over the bar. If something is not up to standards, you will see it flagged.
- You can also go directly to each repository by clicking on the name of the repository at the bottom of each column.
Other Criteria
- For each specific criteria (Issues, Complex Files, Duplication, and Coverage), you can click on its tab to compare repositories.
- This comparison will display your repositories' current statuses against the average and against your goal for this criteria.
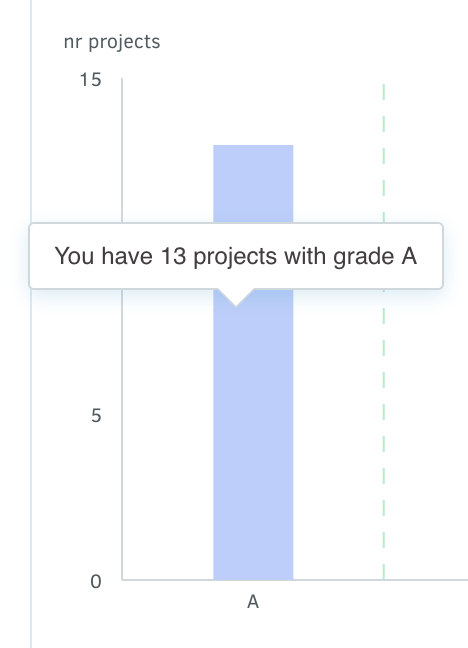
If you have over 8 repositories, you will see your repositories grouped by Grade or by the interval of Issues (number of repo you have with Issues between 0%-20%, 20%-40%, 40%-60%, 60%-80%, 80%-100%).
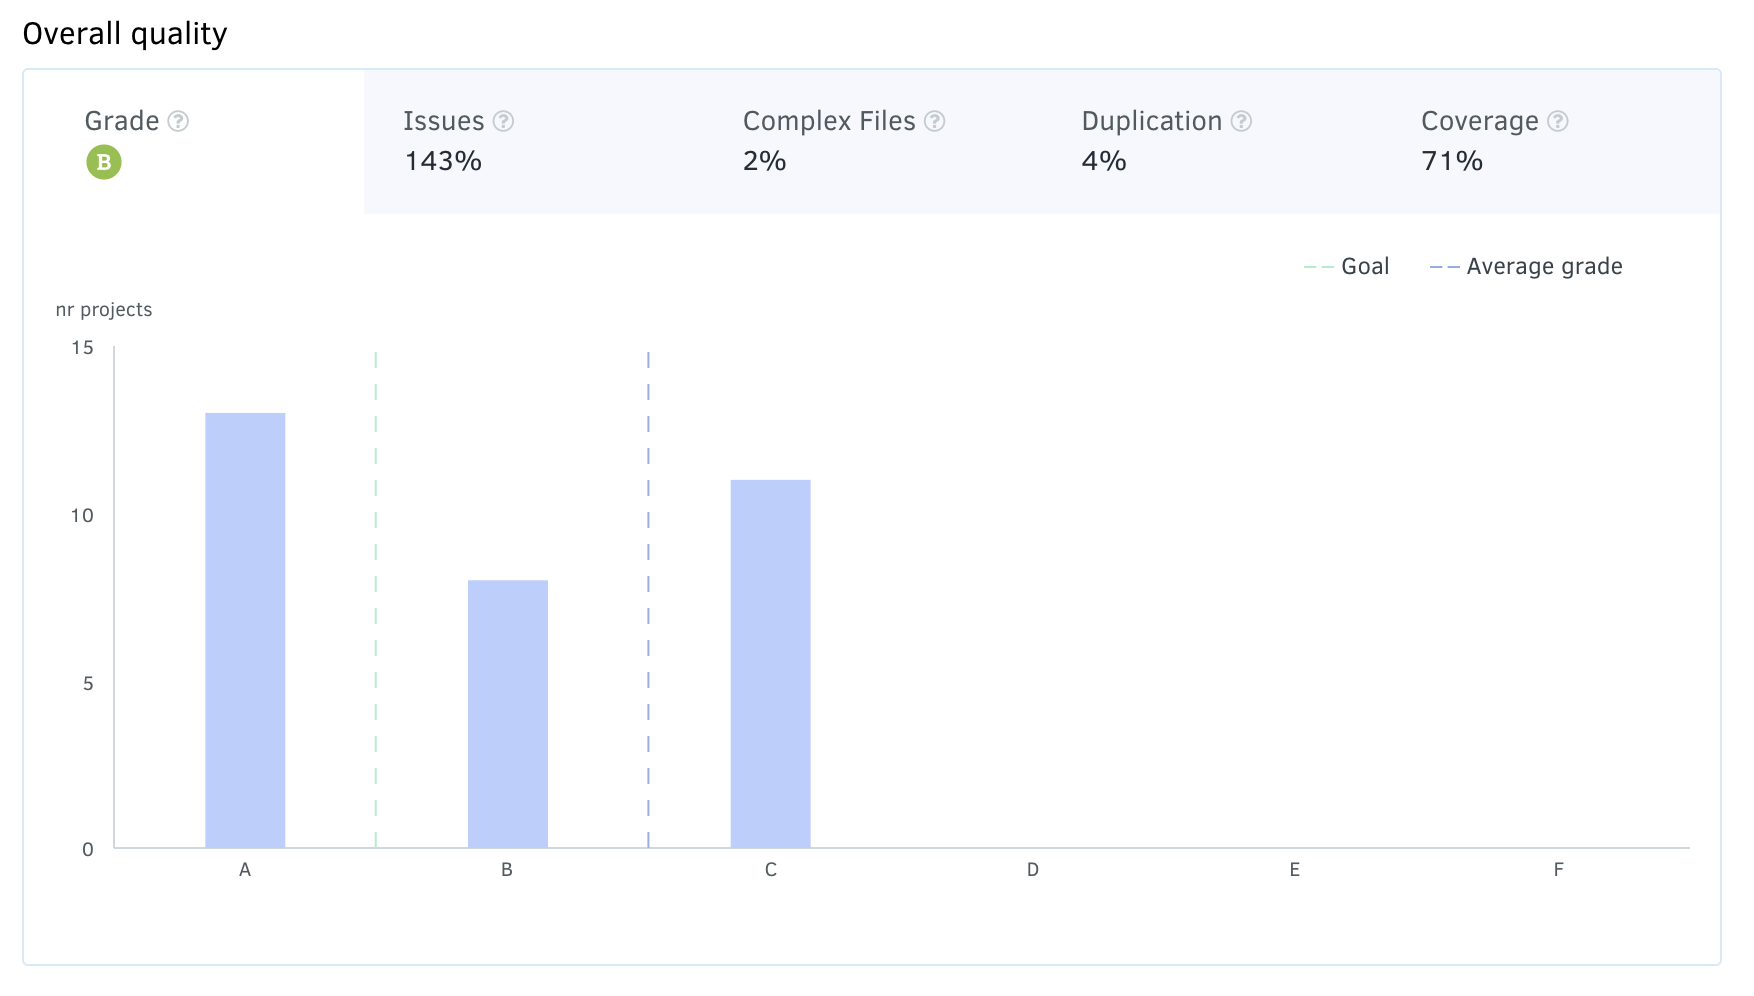
Hover over each group of repositories to see a summary.
What if you don't have Coverage set up?
The graph will notify you when you click on the Coverage tab if you don't have Coverage set up for any of your repositories.
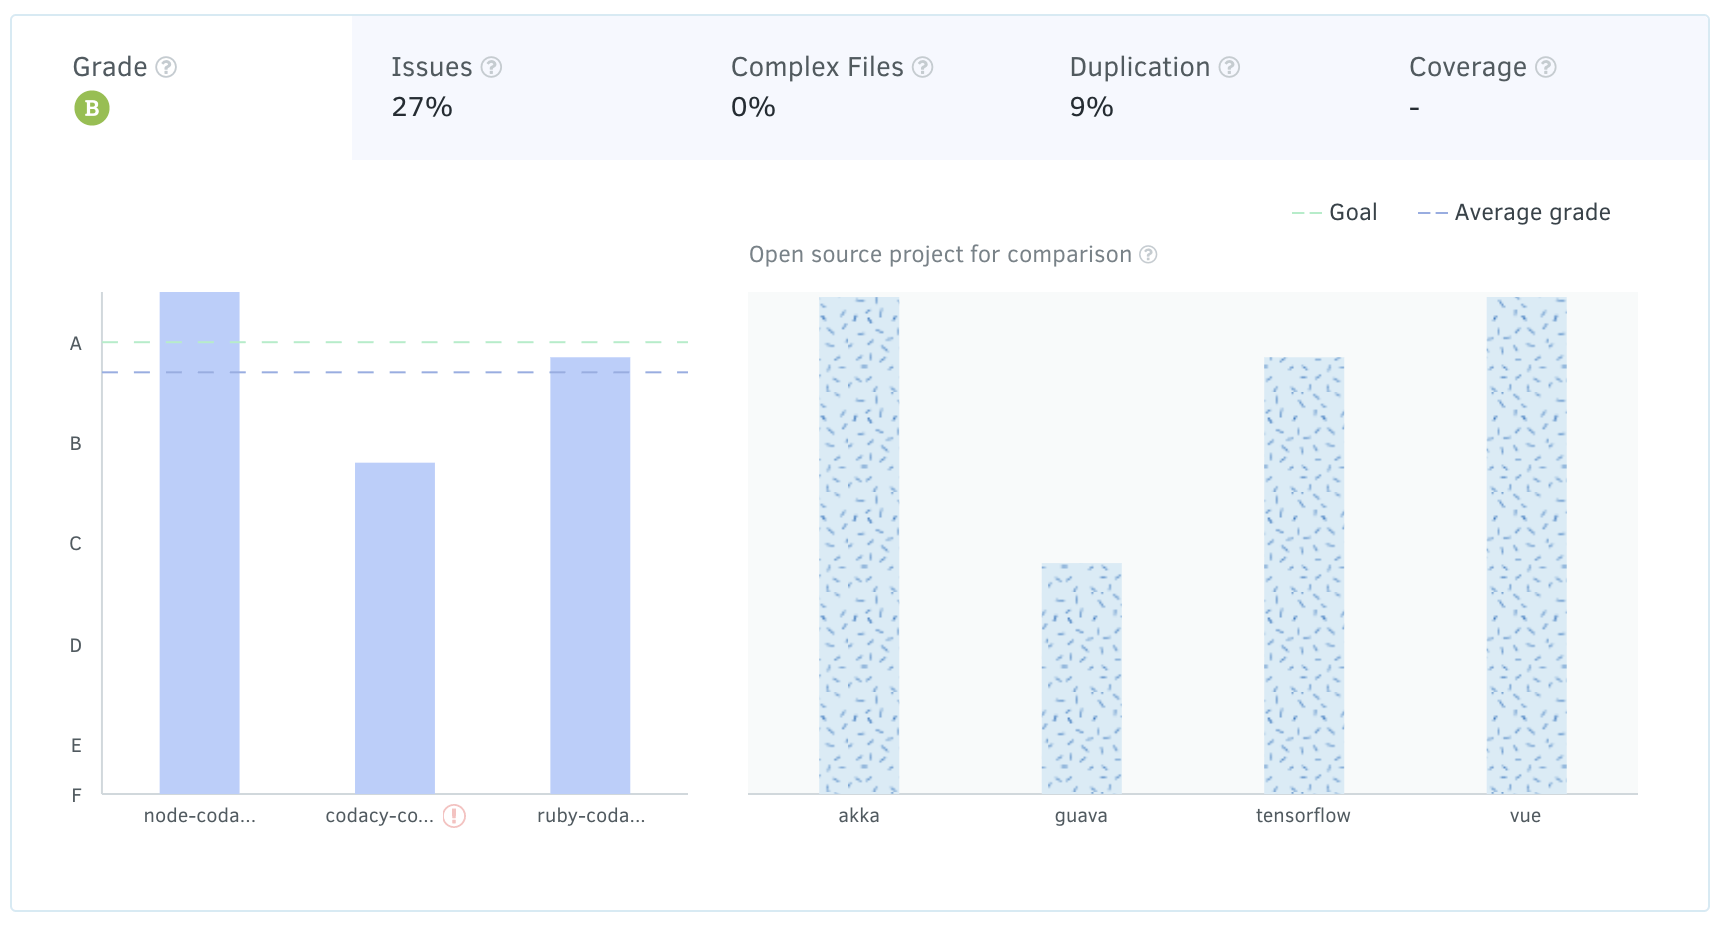
What if I don't have enough repositories for comparison?
If you don't have enough enough repositories for comparison, don't worry - we have included some Open Source repositories for comparison so you can see how you match up.
2. Hotspots
Hotspots are items that require your attention. You can click through on each to view the pull requests or dismiss them. This will dismiss the item for everybody in your team. Read more about hotspots here.
3. Open pull requests
Under this section you can see two tabs: Most problematic pull requests (PR) and Last updated pull requests. These represent a short list of the open pull requests on the repositories of the Team you selected.
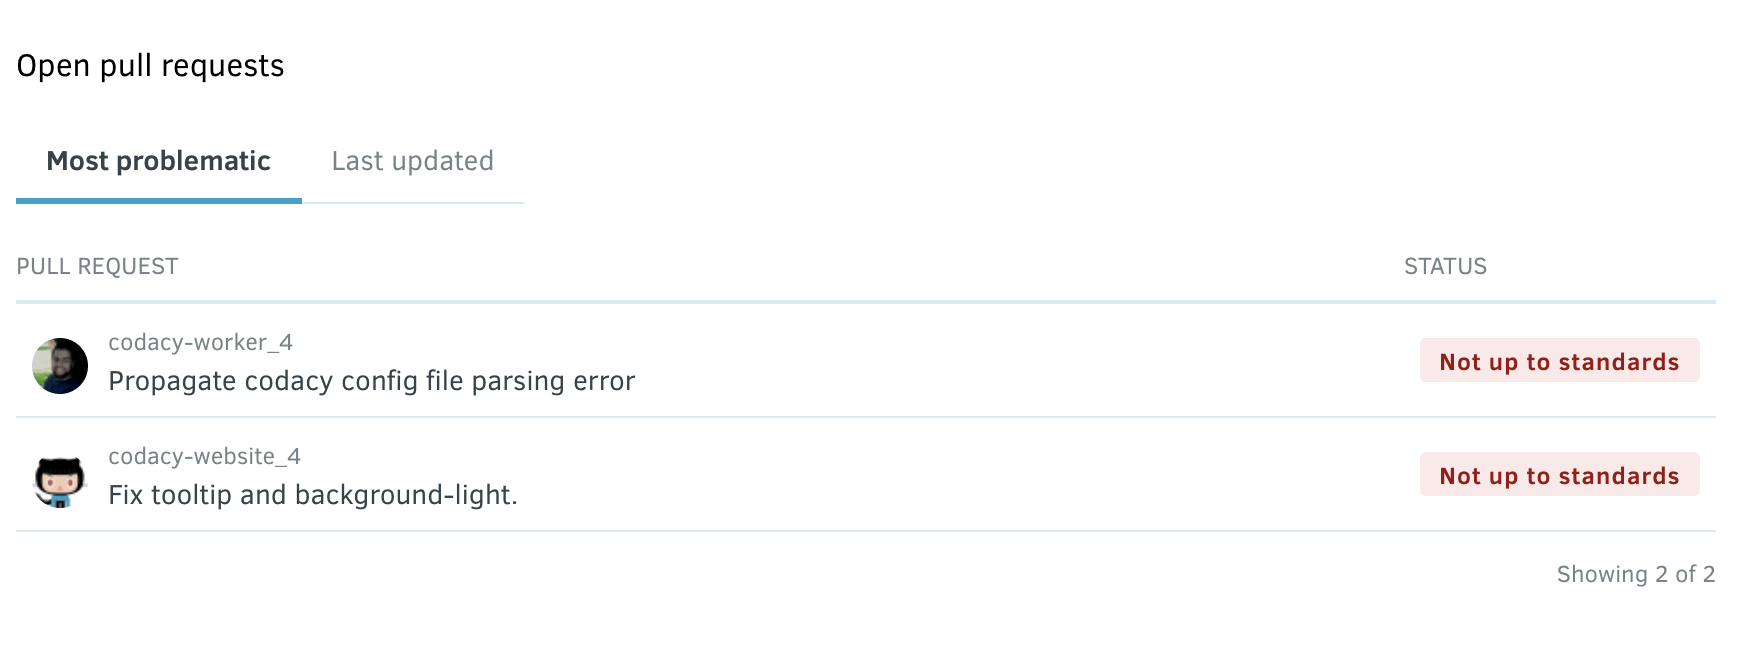
Most problematic
Here you can see a short list of the most problematic open pull requests in all repositories of the team(s) selected. These pull requests are defined as those not up to your defined standards that have the most potential to negatively affect your code quality.
You can click directly on each pull request to see more details.
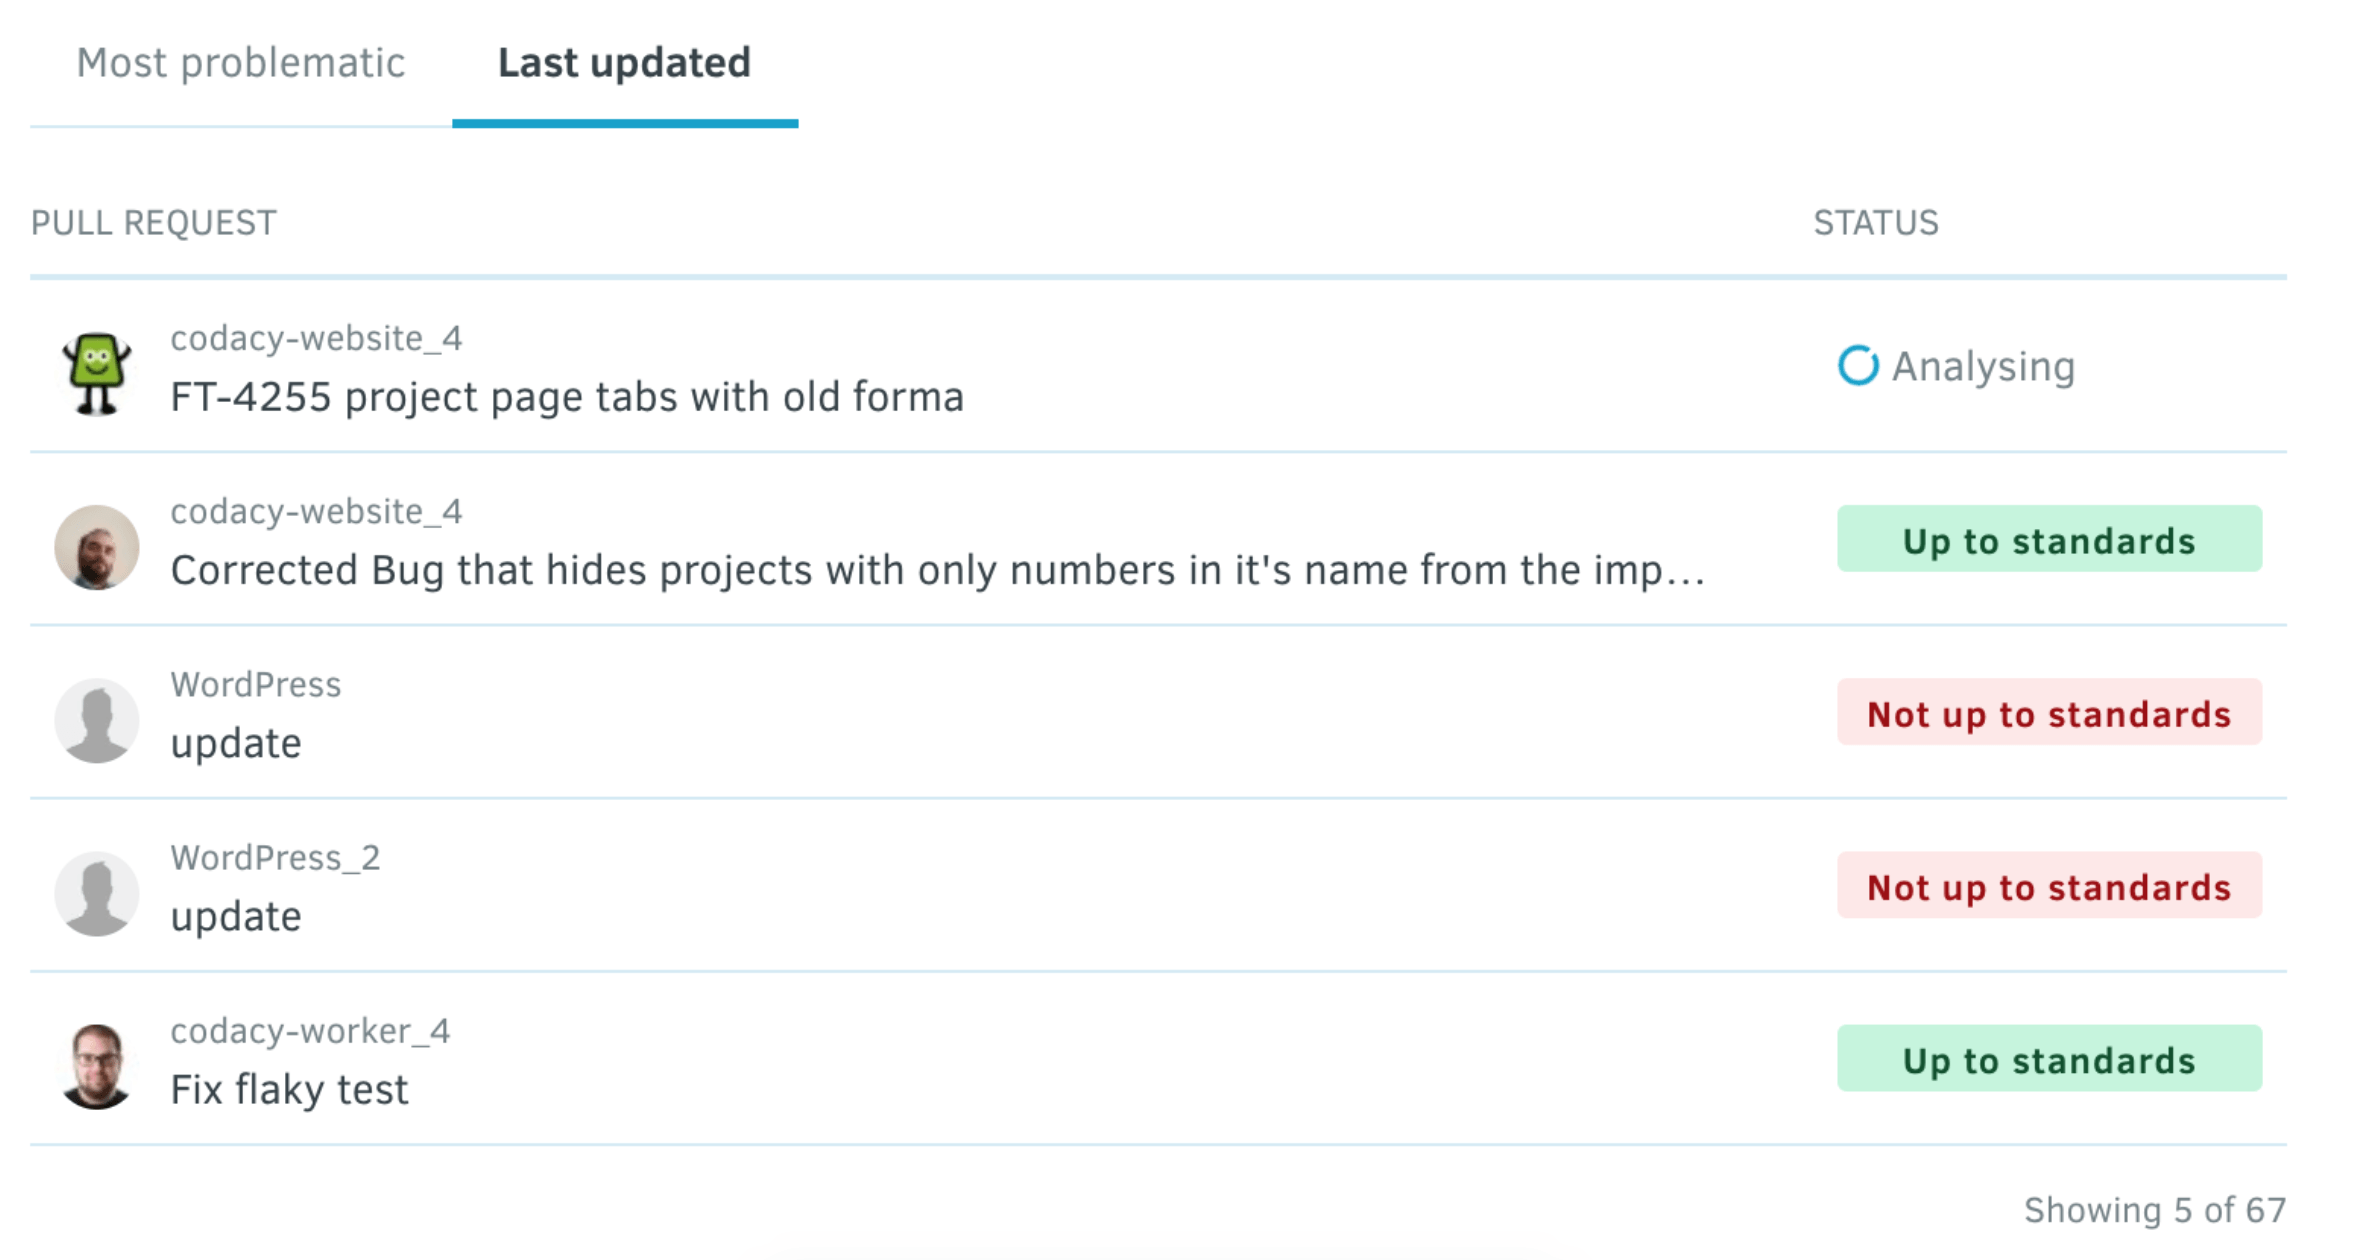
Last updated
This tab displays a short list of all open pull requests sorted by the date of update with a status. Pull requests can be: "Not up to standards", "Up to standards", "Analysis failed" (in case something went wrong during the analysis) or "Analyzing" (an intermediate status while the pull request is under analysis).
4. Logs
Logs display a list of all relevant activity in your organization. You can read more about them here.
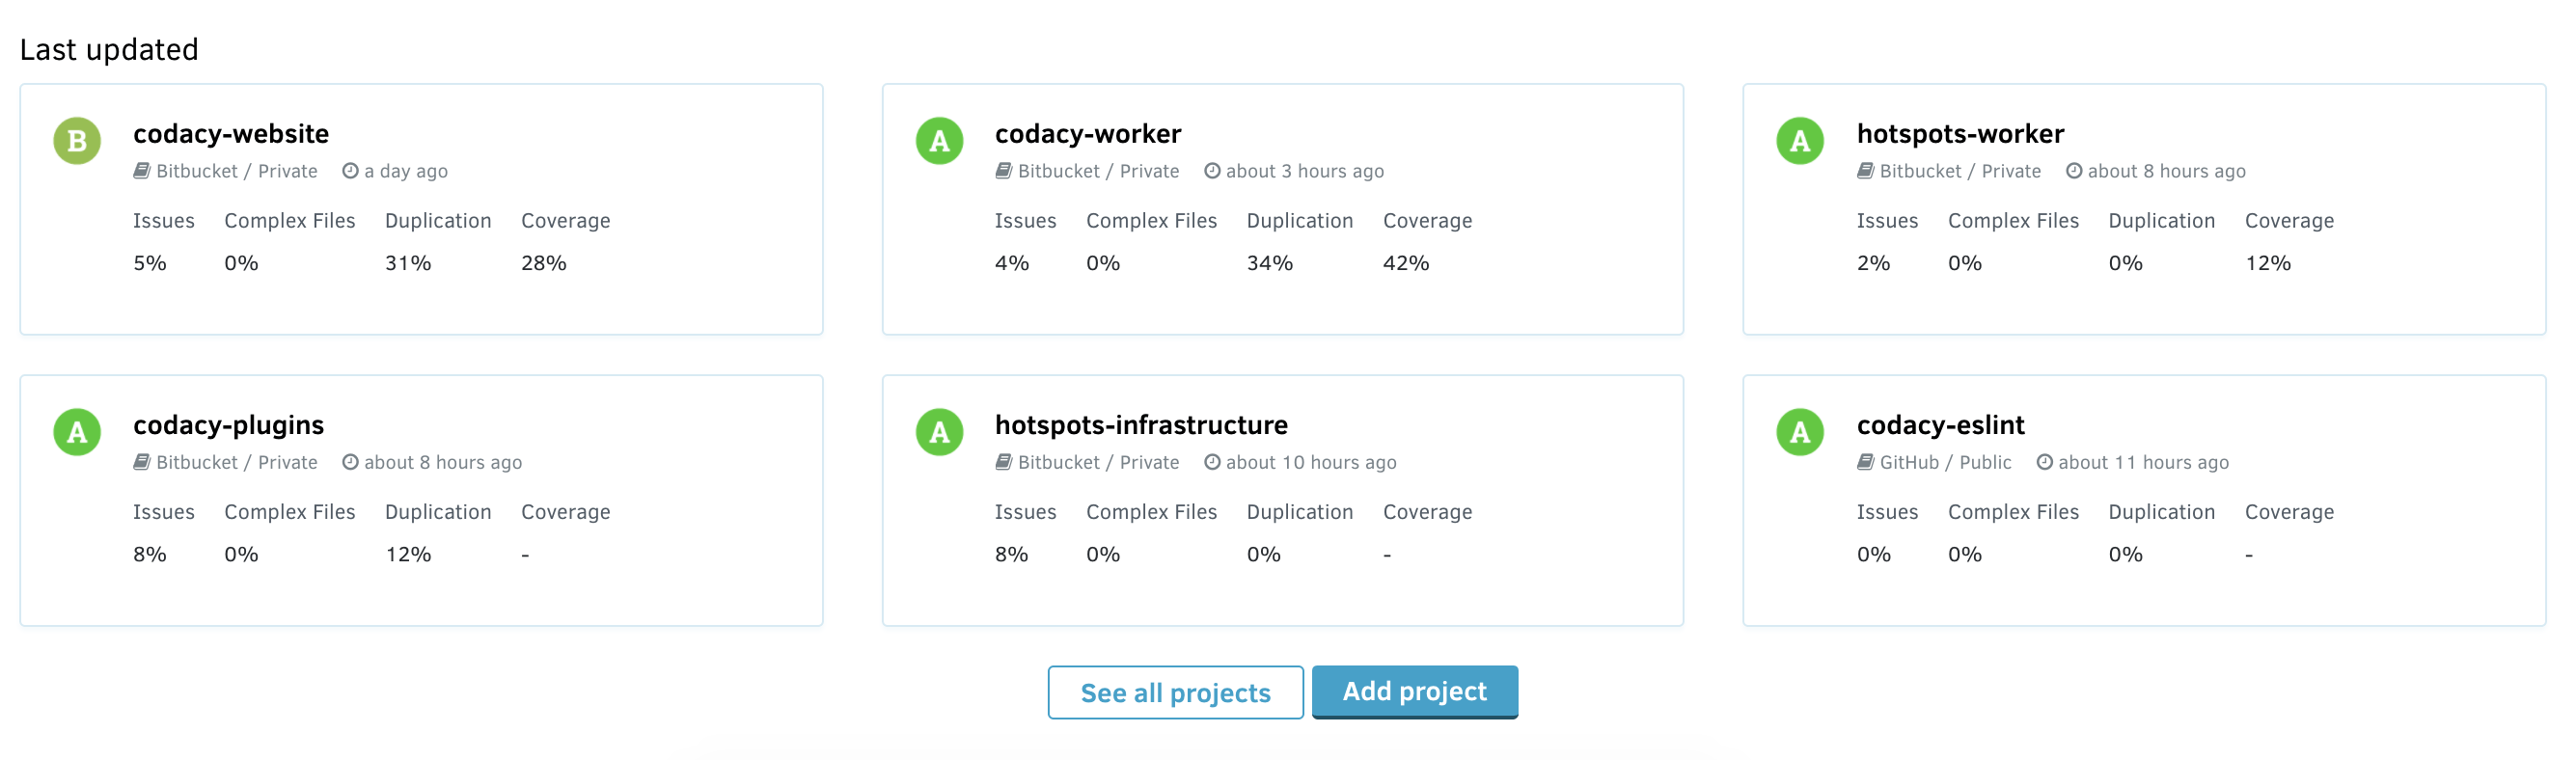
5. Last updated repositories
This section displays a maximum of 6 repositories by date of last update. Each repository card will display the date of the last update, the current grade, and the status for each criteria.
You can also See all repositories or Add a repository here.
We would love your feedback on what you think about the Organization Dashboard and how you think it could be improved. Please feel free to reach out!
Share your feedback 📢
Did this page help you?
Thanks for the feedback! Is there anything else you'd like to tell us about this page?
255 characters left
We're sorry to hear that. Please let us know what we can improve:
255 characters left
Alternatively, you can create a more detailed issue on our GitHub repository.
Thanks for helping improve the Codacy documentation.
If you have a question or need help please contact support@codacy.com.