For the latest updates and improvements, see the latest Cloud documentation instead.
Repository Dashboard overview
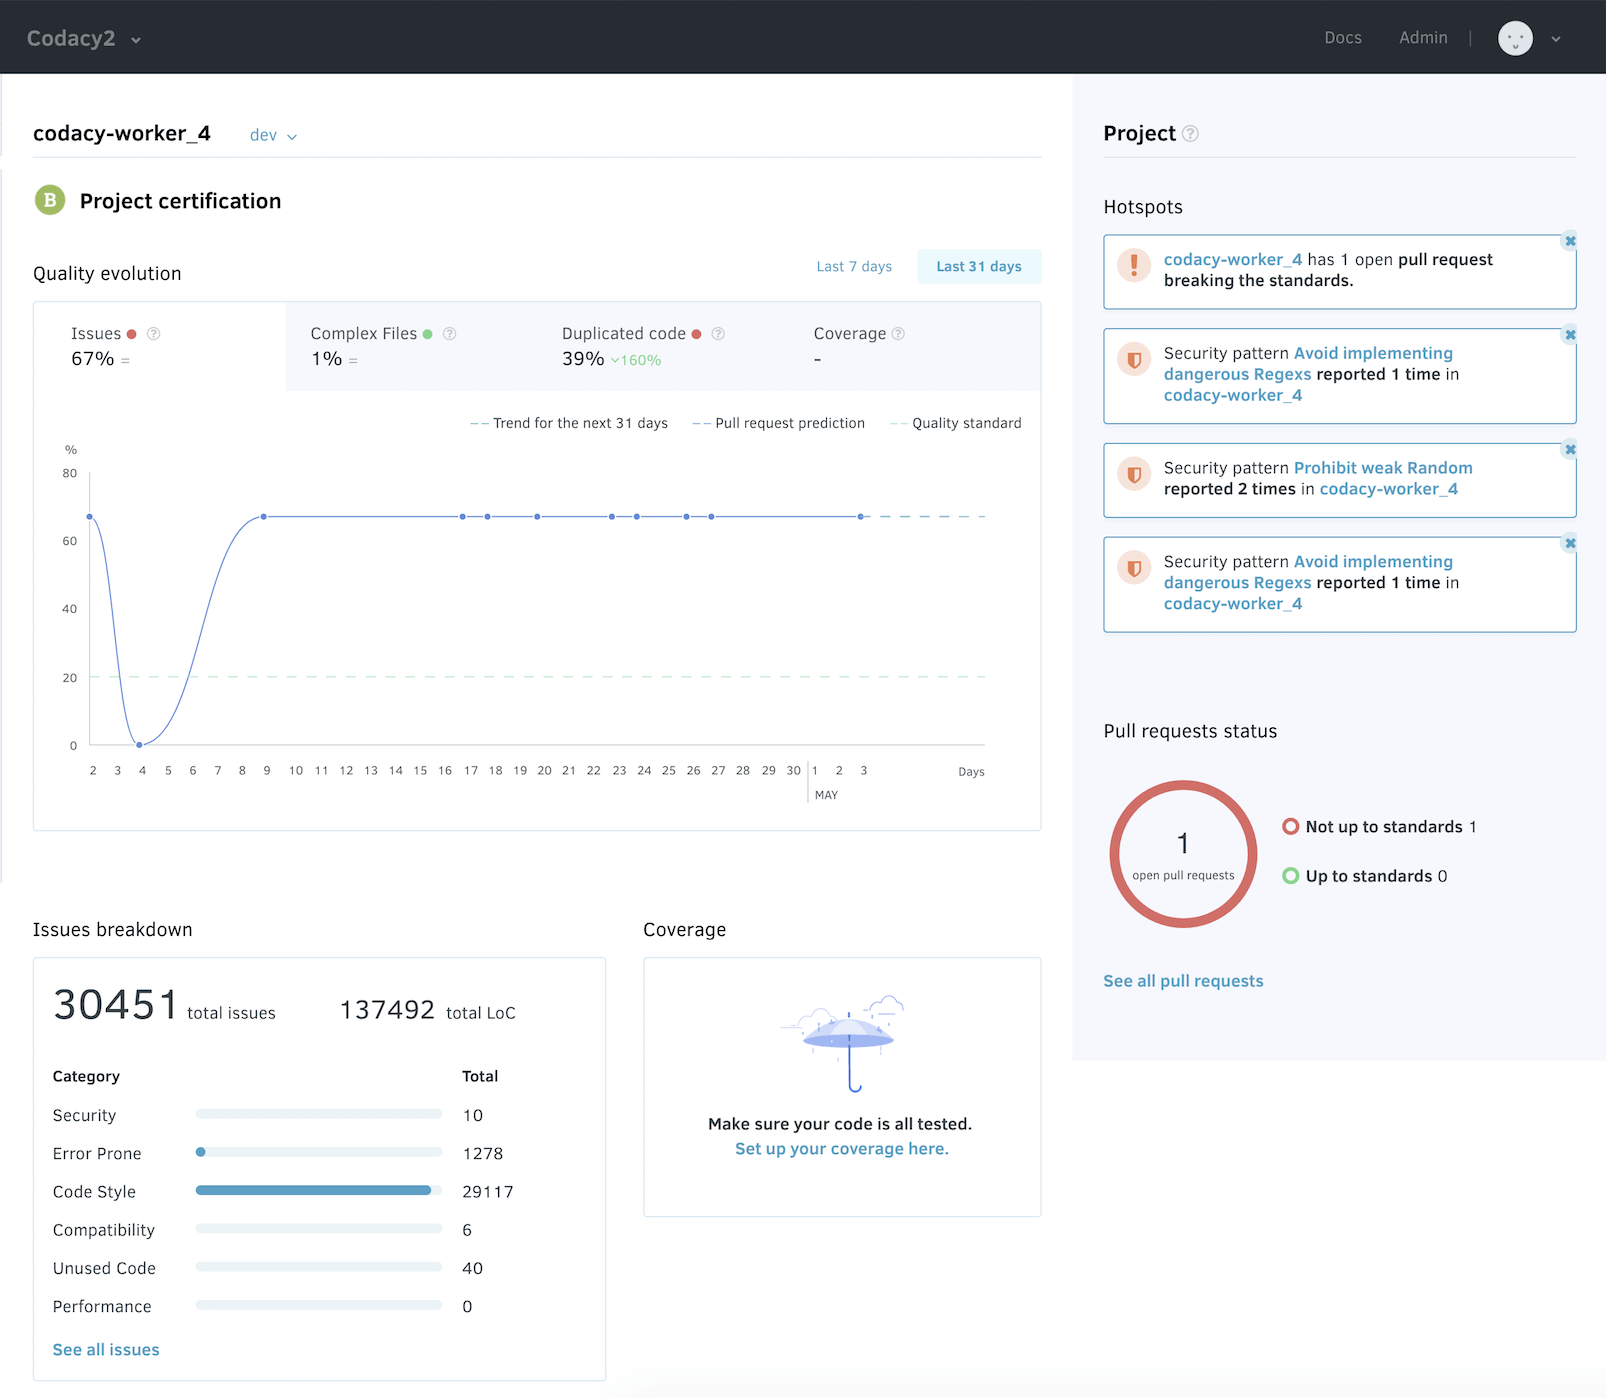
On your Repository Dashboard you get an overview of the repository and attention points we select for you on relevant items requiring your intervention. Read below for a full description of this dashboard and all the functionalities behind it!
How does it look?
On the Repository Dashboard you can find two main sections: the repository view of a specific branch (on the left side (in white) and the main branch summary view on the right side (in gray). Overall, you will find 3 main sections on the branch specific section: 1 Quality evolution Chart, 2 Issues breakdown, 3 Coverage status; and on the main branch section: 4 Hotspots, 5 Logs and 6 Pull requests status sections.
How can I access the Repository Dashboard?
You can access the Repository Dashboard by selecting on the Organization Dashboard a specific repository, or by trying to access a repository URL for any part of our platform.
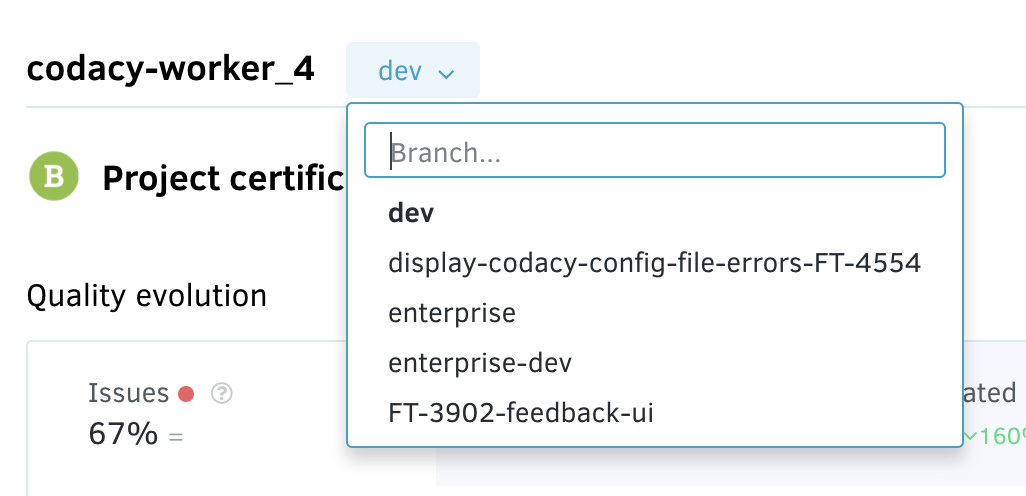
On the Repository Dashboard you can select which branch you want to see details for. You can do this by selecting (or searching on the search bar) for a specific branch, next to the name of the repository:
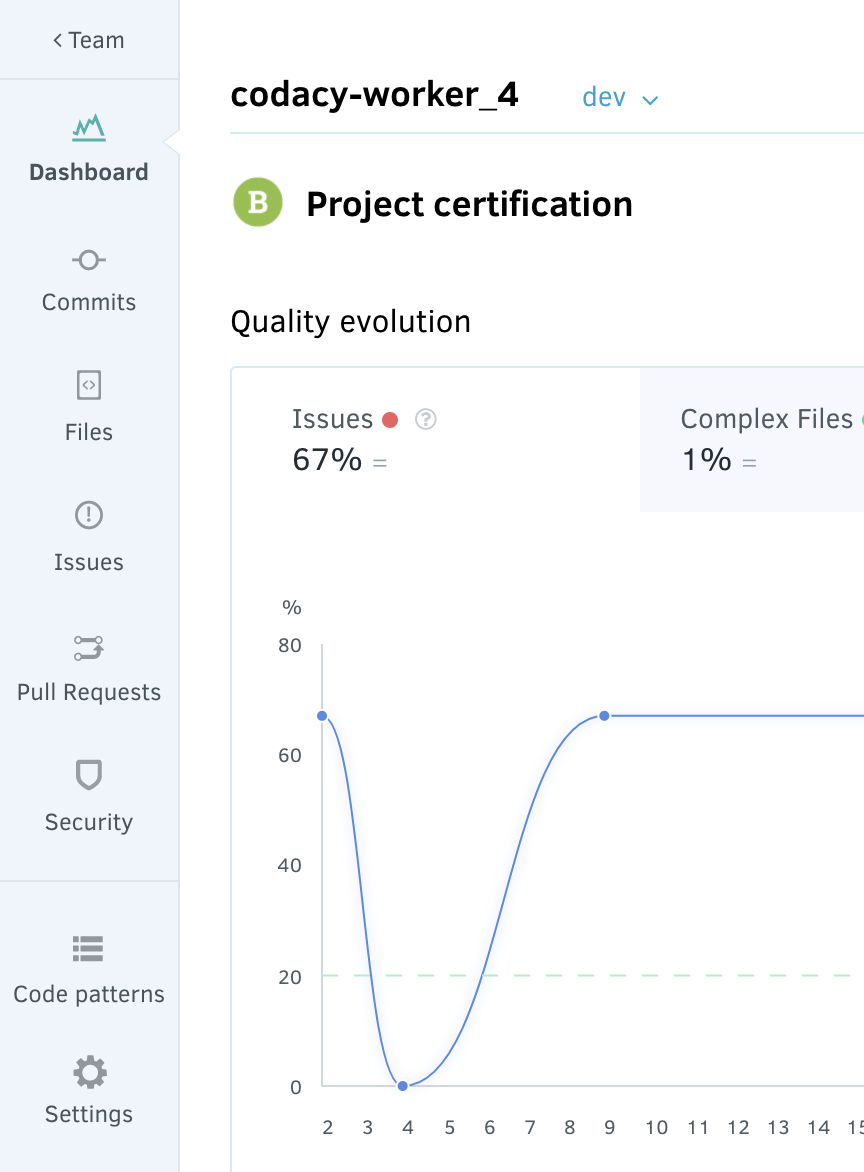
At any given moment in time, you can go back to your Organization view by clicking on "Team" on the left navigation sidebar. Or you can navigate to all the different menu options available on the repository view: Commits, Files, Issues, Pull Requests, Security, Code Patterns and Settings. If you click "Dashboard" at this level, you will always go back to the Repository Dashboard view.
What are the functionalities available?
1. Repository certification and Quality evolution
Here you can see the grade of the repository, and you can see the quality evolution of the repository on the Quality evolution Chart.
On the chart you can select to see results for the "Last 7 days", forthe "Last 31 days" or for the "Last 8 commits" if you don't have data from the last 31 days.
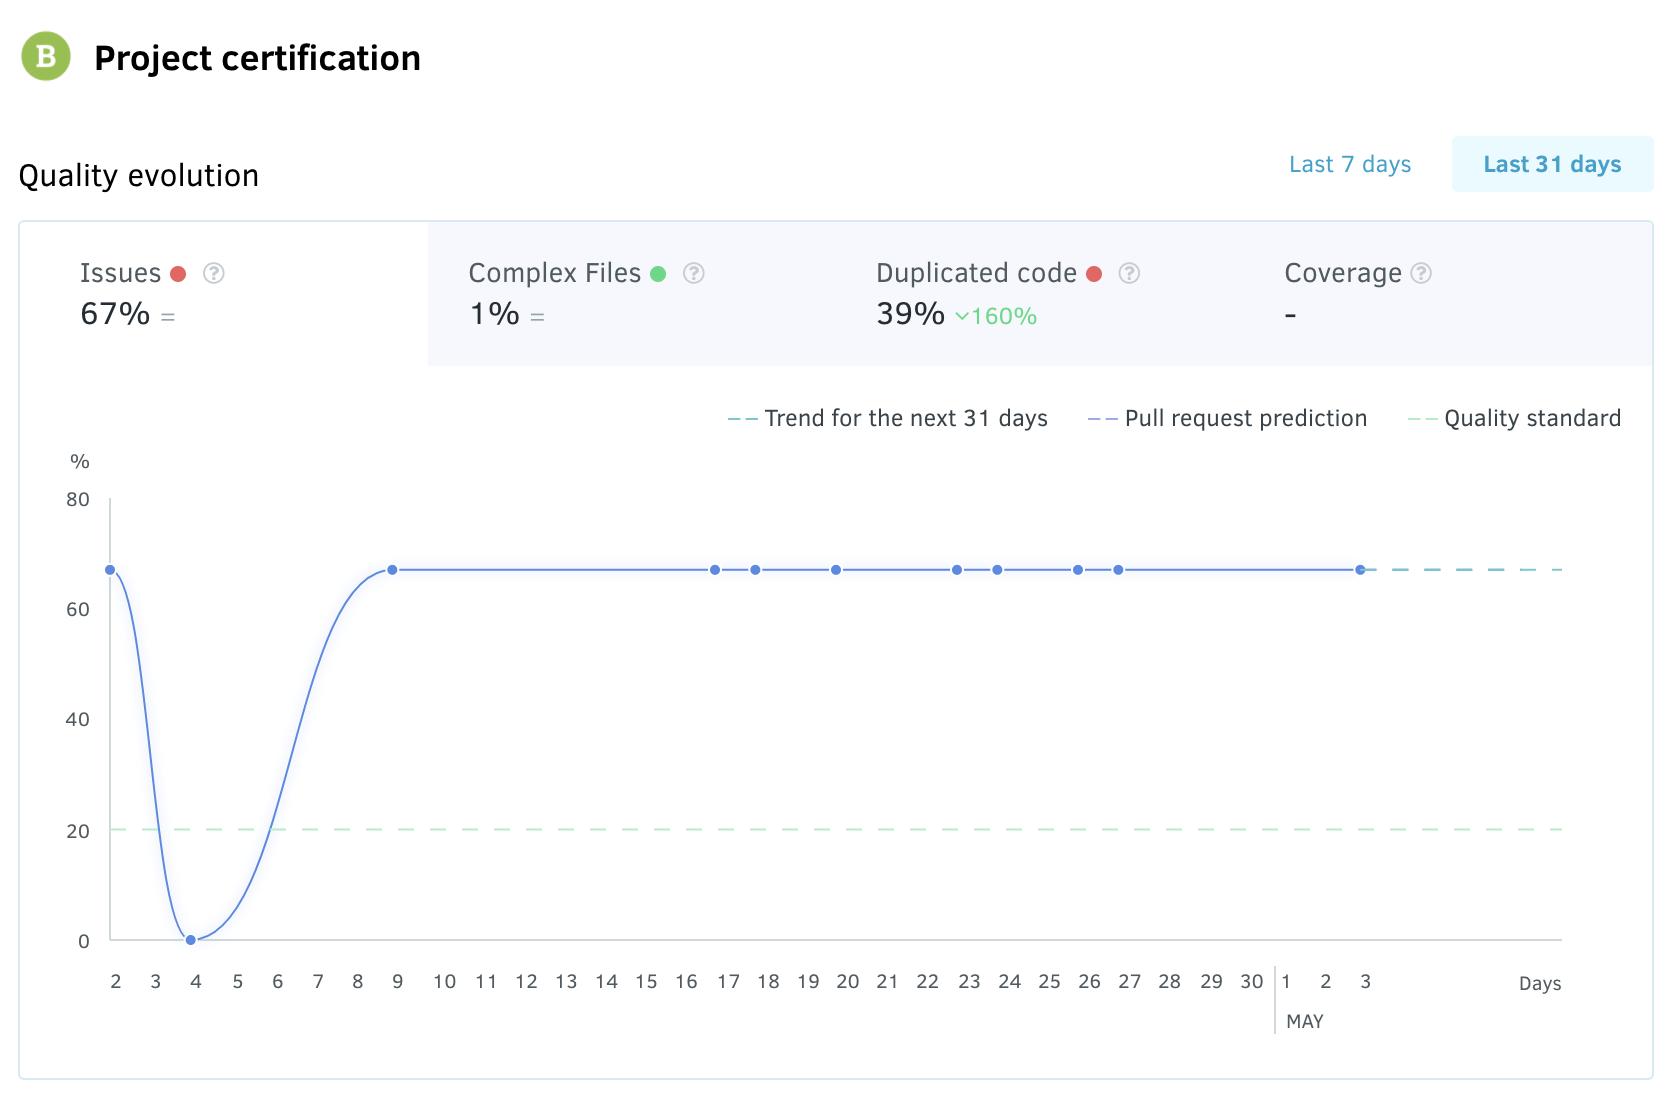
You can see, per criterium (Issues, Complex Files, Duplicated code and Coverage), how the repository is behaving on the last x days. You can navigate on the different criterium by clicking on the tabs of the chart.
You can also see, the trend for the next 31 days (assuming the past behavior), the pull request prediction (the changes caused by open pull requests if they are not changed) and the quality standard (defined on the repository Quality Settings).
In the example you see "Issues" with a red indicator ![]() meaning the number of Issues is above what was defined on the quality standards. Also, we can see next to each criterium a delta (can be "=", a drop or an increase), representing the changes observed in the period selected. In the example, there was no change of number of Issues on the last 31 days, however there was a decrease of 160% of duplicated code.
meaning the number of Issues is above what was defined on the quality standards. Also, we can see next to each criterium a delta (can be "=", a drop or an increase), representing the changes observed in the period selected. In the example, there was no change of number of Issues on the last 31 days, however there was a decrease of 160% of duplicated code.
You should know for Issues/Complex Files/Duplicated code (the more we have it, the worse we are), being above of the defined standards is considered bad, so the indication will be ![]() while for Coverage (the more we have it, the better we are), being above of the defined standards will be flagged with
while for Coverage (the more we have it, the better we are), being above of the defined standards will be flagged with ![]() .
.
Still with regards to coverage it only shows a value if the most recent commit received a coverage report. We do this as one commit can easily change the size or number of files on the repository and even remove some of the files that had coverage information.
For the case when you don't have recent data, we will display by default an option on your graph - "Last 8 commits", and we display the quality evolution (and all the other metrics) for your last 8 commits analyzed on Codacy.
2. Issues breakdown
Here you can see the total of issues on the branch selected.
Additionally, you will see a breakdown of the issues found per category of issue. By clicking on the name of the category, you will be directed to the list of issues filtered by that category.
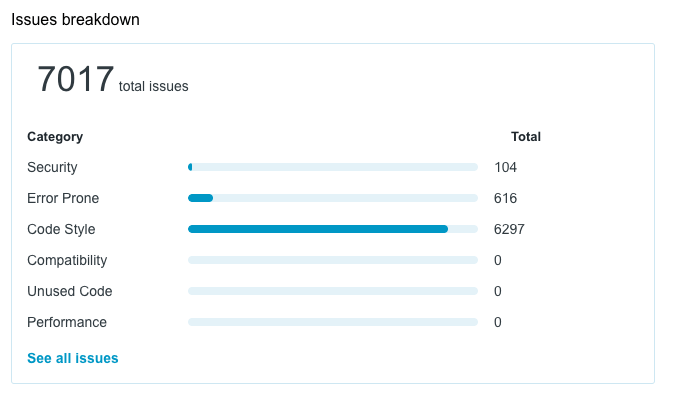
You can also click on "See all issues" and go to the list of issues with no category selected. In case you don't have issues this component will display 0 issues (in the total and in all categories).
3. Coverage status
On this component of the Repository Dashboard you will see the number of files without coverage, the number of files with coverage "not up to standards" and files with coverage "up to standards" based on your quality settings (defined at the repository level). If you click on "See all files" you will go to the list of files.
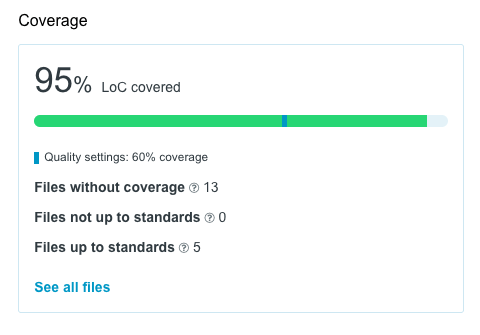
In case you don't have coverage set up for this repository we will let you know on this component, and you can click on "Set up your coverage here" (in case you have "write" permission on the Repository) and go to the repository settings to configure set up coverage.
4. Hotspots
You have a section of relevant items that require attention on the Repository. On this section you can see a set of attention points, you can click on them or dismiss them, in case you don't feel they are relevant. We have created a full article on this, so that you can learn more about it.
5. Logs
You have a section of relevant activities that happened on the repository you selected. We have created a full article on this, so you can learn more about it.
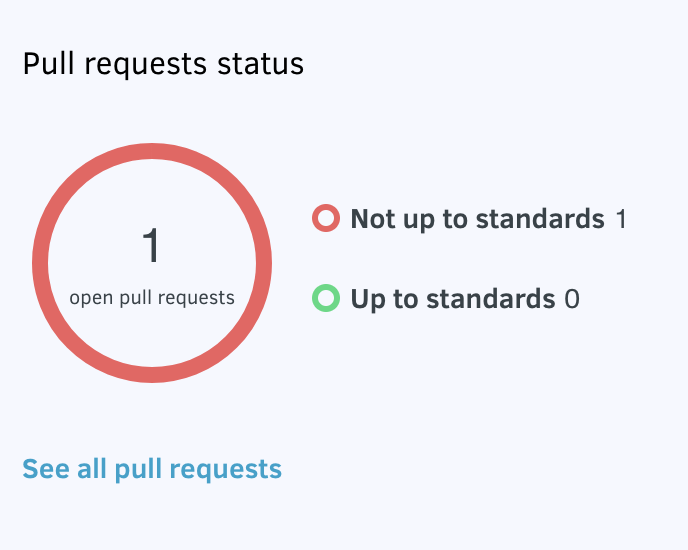
6. Pull requests status
Under this section you will see a display of all open pull requests for this repository and their split between "Not up to standards", "Up to standards" and "Analysis failed". If you click on "See all pull requests" you go to the Pull requests page for that repository.
We would love your feedback, in case you want to let us know what you think about the Repository Dashboard, how it could be improved, etc feel free to reach out!
Share your feedback 📢
Did this page help you?
Thanks for the feedback! Is there anything else you'd like to tell us about this page?
255 characters left
We're sorry to hear that. Please let us know what we can improve:
255 characters left
Alternatively, you can create a more detailed issue on our GitHub repository.
Thanks for helping improve the Codacy documentation.
If you have a question or need help please contact support@codacy.com.