Commits page#
The Commits page displays an overview of the commits in your repository, such as the analysis status and the code quality metrics for each commit. This allows you to monitor the evolution of the code quality per commit in your repository.
By default, the page lists the commits on the main branch of your repository, but if you have more than one branch enabled you can use the drop-down list at the top of the page to display commits on other branches.
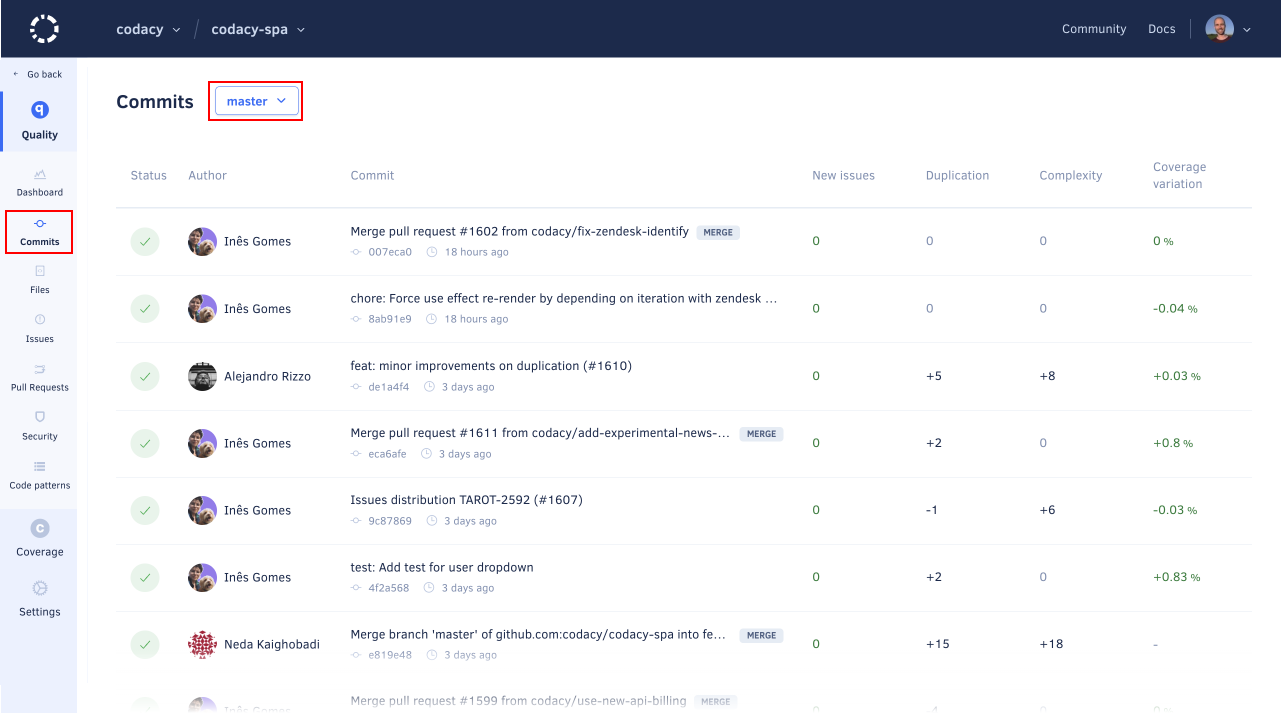
Click a specific commit to see detailed information about the code quality changes introduced by that commit.
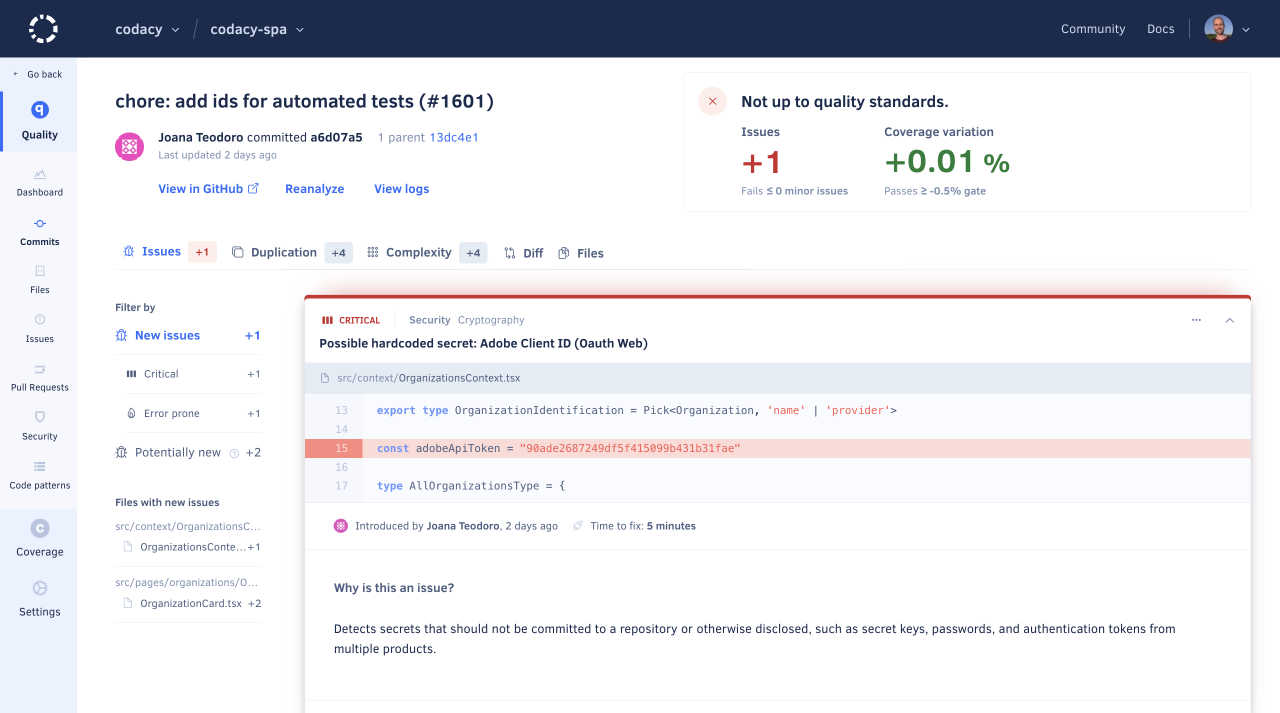
The next sections describe each area of the commit detail page.
Commit status#

This area displays the information that identifies the commit (commit message, committer, SHA hash, and last updated date), as well as:
- A link to the commit on your Git provider
- A link to reanalyze the commit, present when the committer is part of your organization
- A link to view analysis logs
Commit quality overview#

This area displays the quality gate status for the commit and the code quality metrics with a gate set up:
-
The quality gate status is either Up to quality standards or Not up to quality standards depending on the quality gate rules for your repository.
If there are no gate rules enabled for commits, the status is always Up to quality standards.
-
The variation introduced by the commit is displayed either as a positive or negative variation, or no variation (represented by
=) for code quality metrics with a gate set up:- Issues: Number of new issues
- Duplication: Changes in the number of duplicated code blocks
-
Complexity: Changes in code complexity
-
Coverage variation: Changes in code coverage percentage compared with the parent commit
Depending on the languages being analyzed or if you haven't set up coverage for your repository, some metrics may not be calculated (represented by
-).Note
Learn how Codacy calculates the code quality metrics in more detail:
-
The colors depend on the quality gate rules for your repository:
- Green: The metric passes the quality gate
- Red: The metric fails the quality gate
- Gray: The metric has no value
Note
If you change the quality gate rules you must reanalyze the commit to update the metrics and optionally re-upload the Coverage report if you also changed the coverage gate rules.
Issues tab#
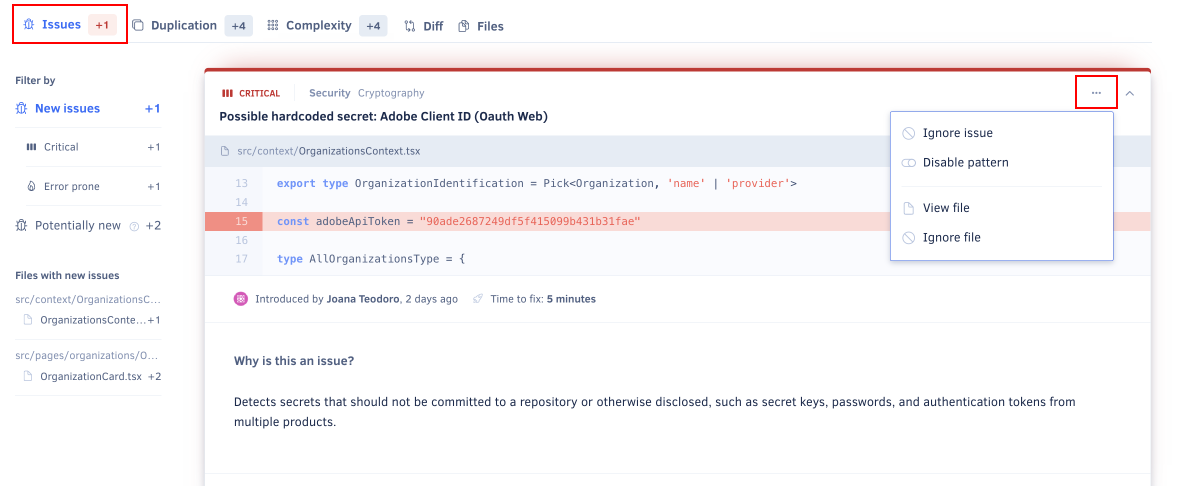
The Issues tab displays the lists of issues that the commit creates or fixes. Use the sidebar filters to filter the list by new issues (including issues of specific severity or category), issues within a specific file, fixed issues, potential new issues, or potential fixed issues.
Click the title of an issue card to expand it and see the following information:
- The committer and date of the commit that introduced the issue, if available
- The estimated time to fix the issue
- What the issue is and how to solve it
- The tool that reported the issue and the related code pattern
- Where's this pattern enabled: coding standard, repository rules, or configuration file
To ignore or manage an issue, click the associated options in the menu.
Potential issues#
Codacy may label some issues as potential, which means that the code analysis detected these issues in lines of code that weren't changed by the analyzed commit. This highlights potential consequences in other parts of your codebase.
The following are example situations that can lead to potential issues:
-
The issue was either created or fixed in the current commit, but the static code analysis tools reported the issue on a line that didn't change in the commit. For example, if you remove the line containing the declaration of a variable you may get an "undeclared variable" issue in other lines that use that variable.
-
If a file had more than 50 issues reported by the same tool and you push a new commit that fixes some of these issues, Codacy will report more issues until the limit of 50 issues. These issues will be potential issues if they're outside the lines of code changed in the new commit.
Note
If you're using GitHub you may see annotations for potential issues reported under Unchanged files with check annotations on the Files changed tab of your pull requests.
This happens when Codacy reports potential issues in files that weren't changed in your pull request. Read more about this GitHub feature.
False positive issues#
Info
The False Positive detection is a business tier feature. If you are a Codacy Pro customer interested in upgrading to gain access to this feature, reach out to our customer success team.
If your commit includes issues detected as false positives, an Ignore all false positives option will appear above the first issue in the list. This allows you to bulk ignore all detected false positives at once.
For more details on managing false positives, see Managing system-detected false positives.
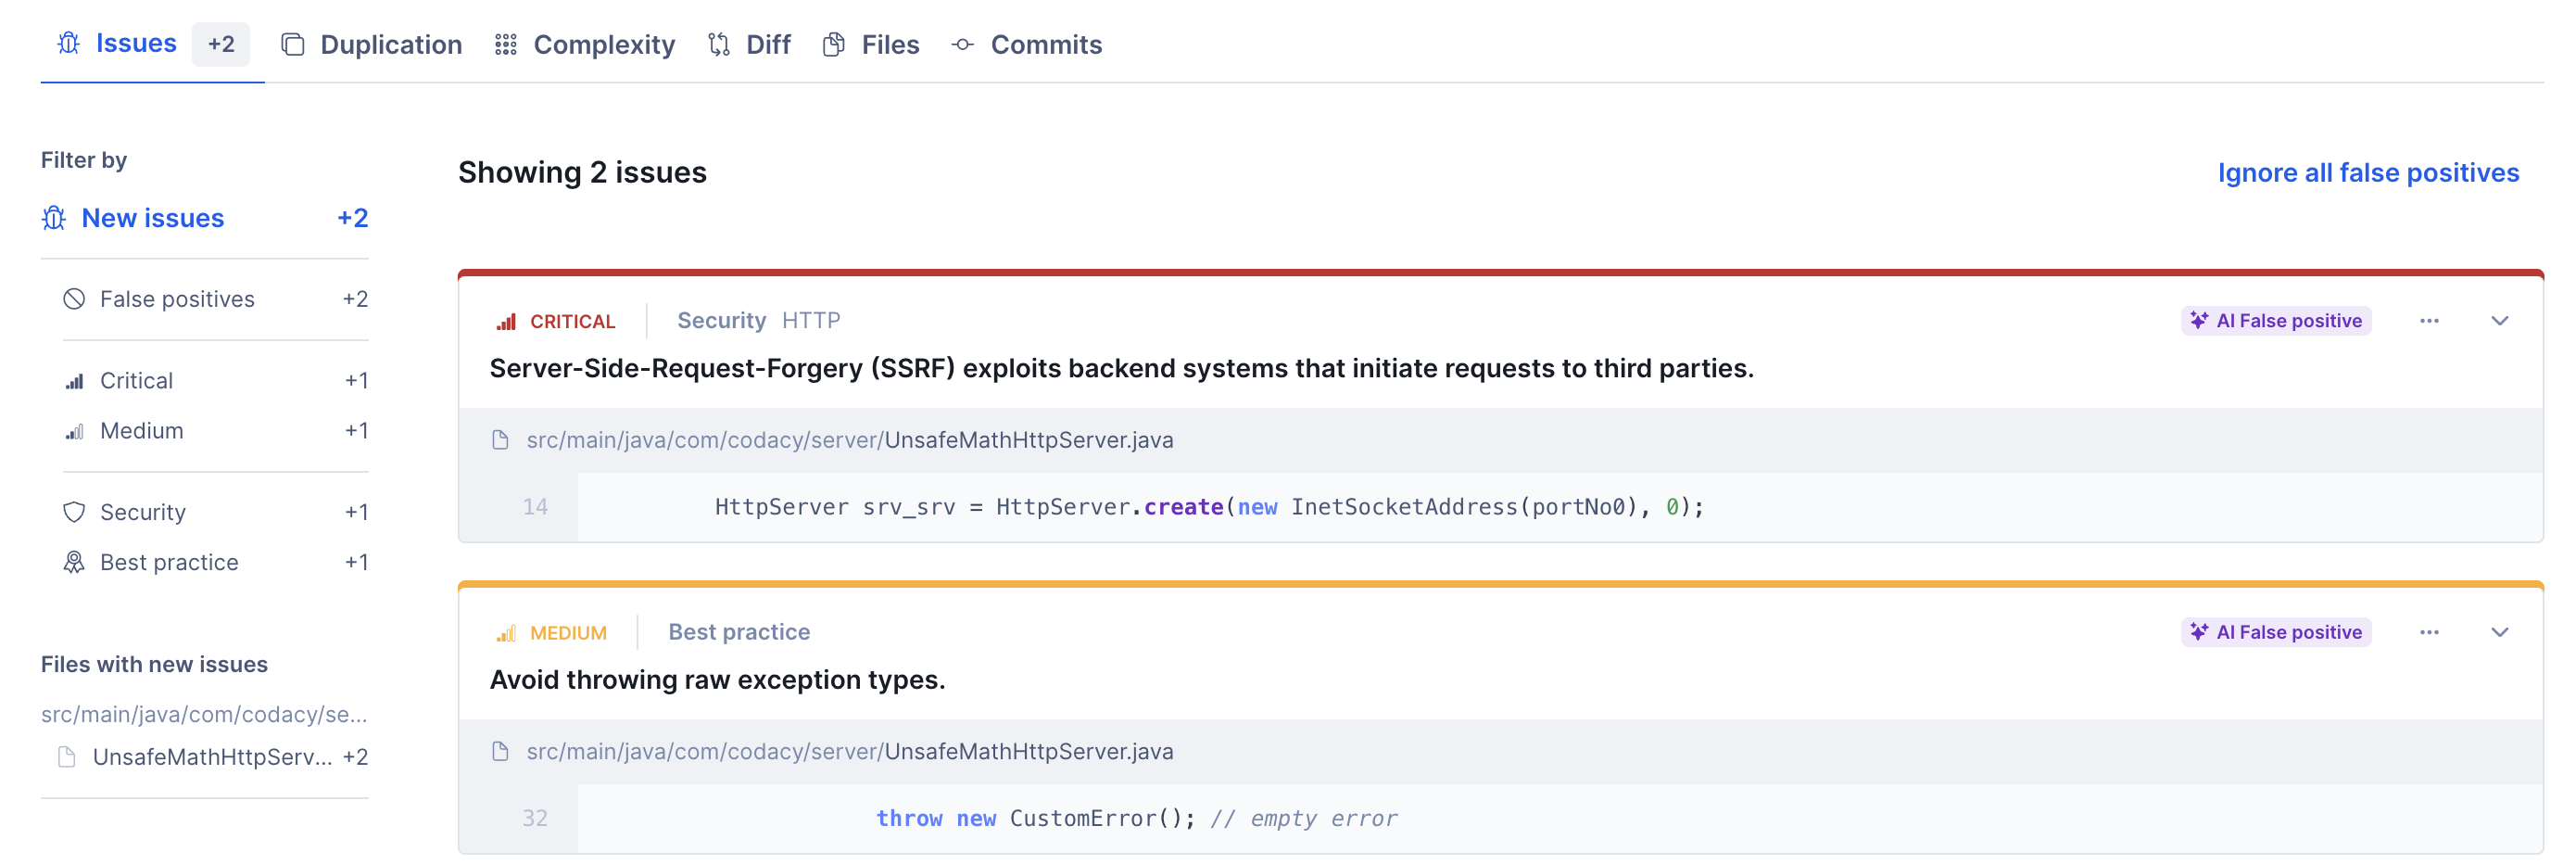
During a pull request analysis, if Codacy identifies issues that appear to be false positives, it will automatically add a comment listing all the detected false positives.

Note
Pull Request comments for False Positives are currently supported on GitHub only.
Duplication tab#
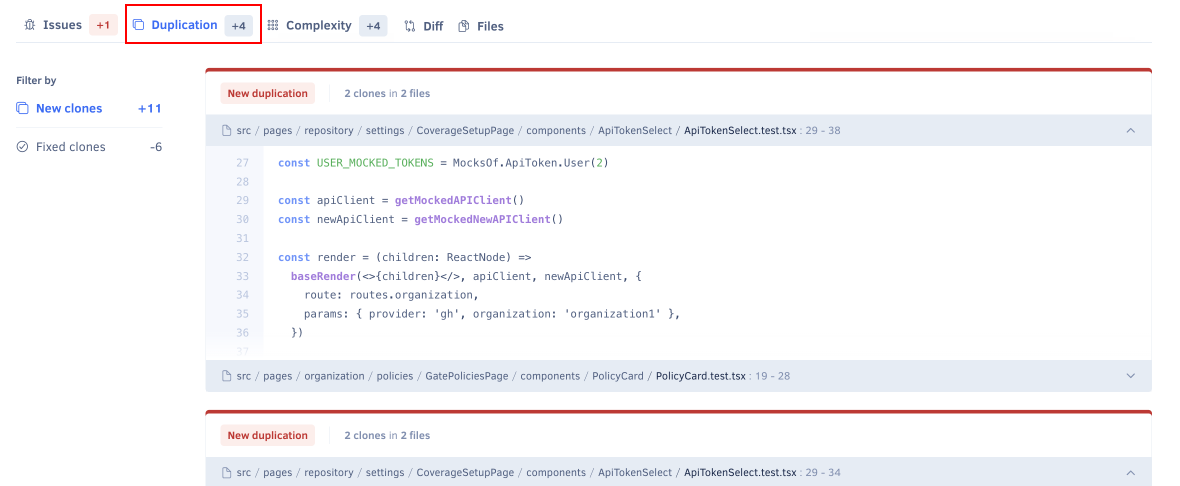
The Duplication tab displays the lists of clones (duplicated code blocks) that the commit adds or fixes. You can click a clone to expand it and inspect the code.
Complexity tab#
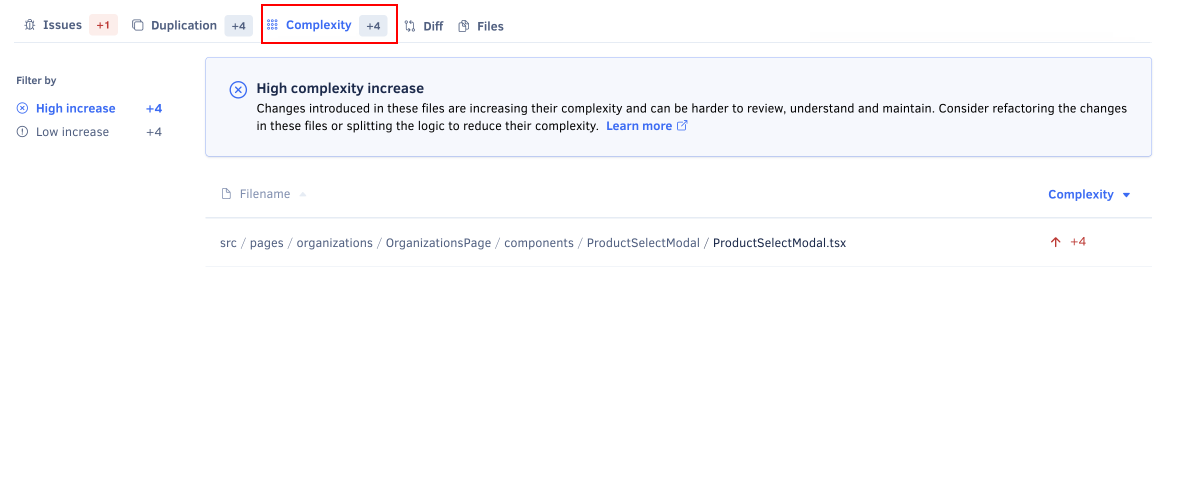
The Complexity tab displays the complexity changes introduced by the commit. Use the sidebar filters to filter the list by high increase (4 or more), low increase (1 to 3), or improvement (less than 0).
Note
For more information, see how Codacy calculates cyclomatic complexity.
Diff tab#
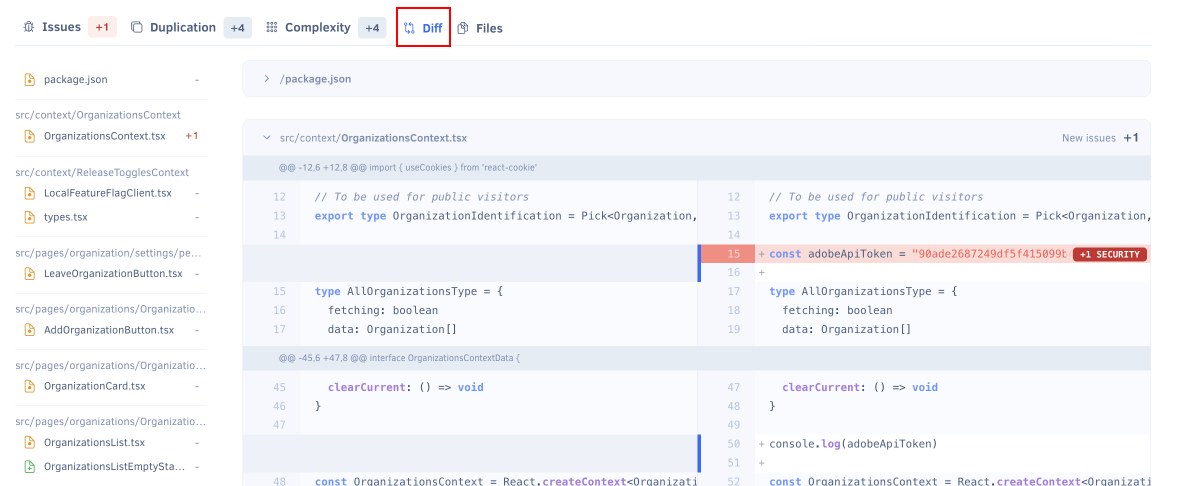
The Diff tab displays the code changes and issues introduced by the commit. It includes the following areas:
-
A list of files modified by the commit, with additional information for each file:
- A green plus icon if the file is added or a yellow dot icon if it's modified by the commit
- The number of new issues introduced by the commit
-
A diff viewer showing for each modified file the diff coverage and a comparison of the old and new file content.
Lines with issues are highlighted according to issue severity and include a pill label with the issue type and count. Hover over the pill label to view more details or navigate to the issues.
Files tab#
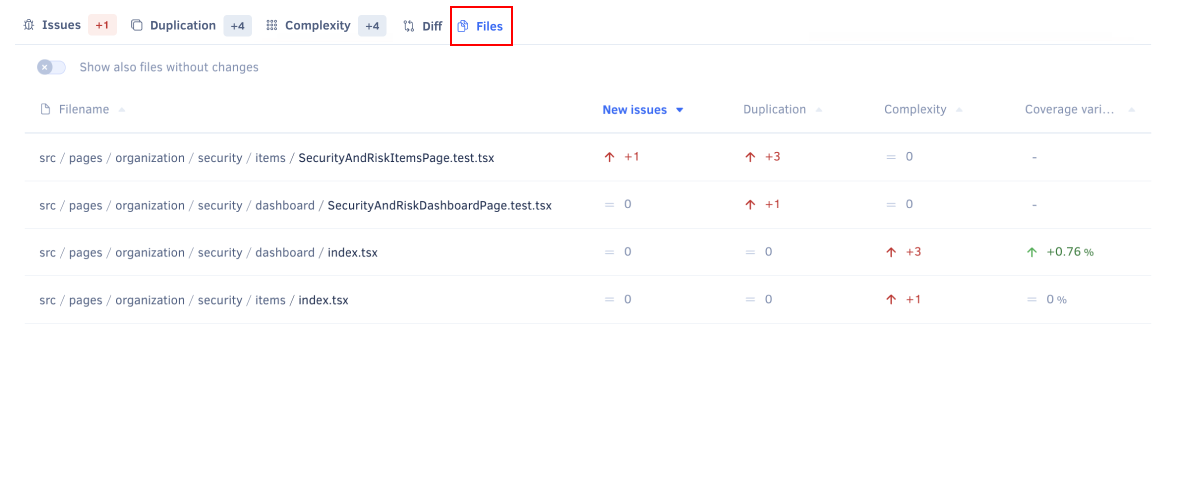
The Files tab displays the variation of the following code quality metrics that the commit introduces to the files in your repository, displayed either as a positive or negative variation, or no variation (represented by =):
- New issues: Number of new issues
- Duplication: Changes in the number of duplicated code blocks
- Complexity: Changes in code complexity
- Coverage variation: Changes in code coverage percentage compared with the parent commit
Depending on the languages being analyzed or if you haven't set up coverage for your repository, some metrics may not be calculated (represented by -).
Viewing analysis logs#
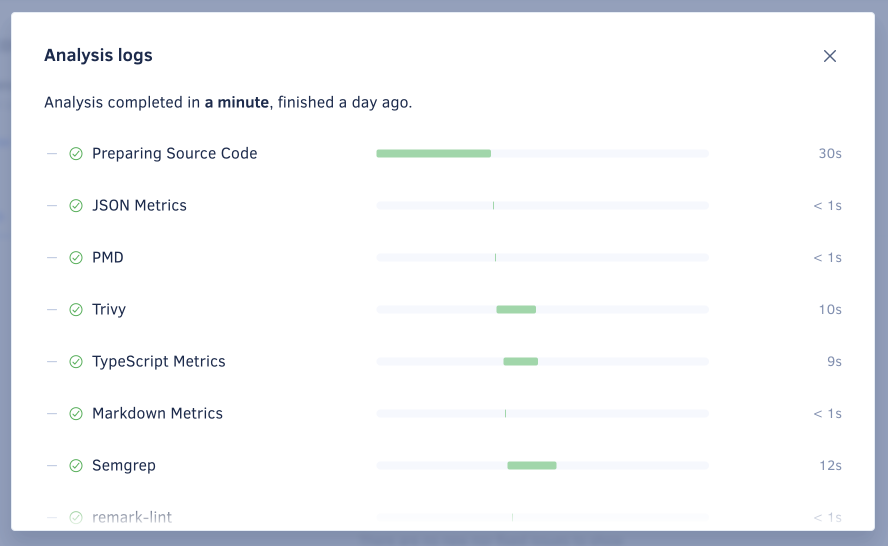
Analysis logs can help you identify the duration of each analysis phase and any potential issues.
To access the analysis logs, click the View logs link in the commit status area. This opens a modal displaying execution times and outcomes for the tools used to analyze the commit.
See also#
Share your feedback 📢
Did this page help you?
Thanks for the feedback! Is there anything else you'd like to tell us about this page?
255 characters left
We're sorry to hear that. Please let us know what we can improve:
255 characters left
Alternatively, you can create a more detailed issue on our GitHub repository.
Thanks for helping improve the Codacy documentation.
Edit this page on GitHub if you notice something wrong or missing.
If you have a question or need help please contact support@codacy.com.